
Concept explainers
Videos
Constructing Frequency Distributions. In Exercises 11–18, use the indicated data to construct the frequency distribution. (The data for Exercises 13–16 can be downloaded at TriolaStats.com.)
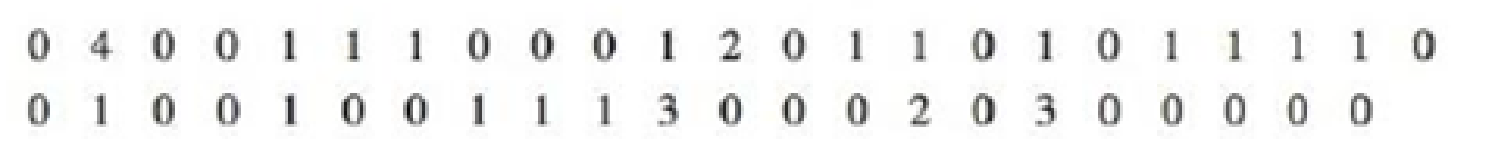
12. Tornadoes Listed below are the F-scale intensities of recent tornadoes in the United States. Construct a frequency distribution. Do the intensities appear to have a

Learn your wayIncludes step-by-step video

Chapter 2 Solutions
Pearson eText for Essentials of Statistics -- Instant Access (Pearson+)
Additional Math Textbook Solutions
Essentials of Statistics, Books a la Carte Edition (5th Edition)
Intro Stats, Books a la Carte Edition (5th Edition)
Introductory Statistics
Elementary Statistics: Picturing the World (6th Edition)
Statistics for Psychology
Statistics: The Art and Science of Learning from Data (4th Edition)


- Frequency distribution table.arrow_forwardFamily Heights. In Exercises 1–5, use the following heights (in.) The data are matched so that each column consists of heights from the same family. Scatterplot Construct a scatterplot of the father/son heights, then interpret it.arrow_forwardIn Exercises 1–3, use the data listed below. The values are departure delay times (minutes) for American Airlines flights from New York to Los Angeles. Negative values correspond to flights that departed early. Test for Normality Use the departure delay times for Flight 19 and test for normality using a normal quantile plot.arrow_forward
- Data is givenarrow_forwardThe frequency distribution shown in the figure lists the annual salaries of the managers at Universal Manufacturing of Melonville. Construct a histogram to represent the data.arrow_forward2.31 The median income for a four-person family has been reported as shown here for 1993–2003. Source: Time Almanac 2006, p. 627. 1993 $45,161 1999 $59,981 1998 56,061 1994 47,012 2000 62,228 1995 49,687 2001 63,278 1996 51,518 2002 62,732 1997 53,350 2003 65,093 Construct a line graph describing these data over time.arrow_forward
- of This frequency table depicts the average hours spent on social media use for students in PSY201 class. Hours Frequency 4 3.5 3 2.5 2 1.5 1 0.5 0 10 5 5 3 7 16 0 5 3 How many students spent at least 3 hours on social media in PSY201?arrow_forwardfrequency distribution method is used to organize the data when data is nominal and ordinal. a. Categorical frequency distribution b. Grouped frequency distribution c. Ungrouped frequency distribution d. All Optionsarrow_forwardComplete the frequency distribution shown below.arrow_forward
- Use the following table to answer questions 6–9. Monthly Water Bills Jan Feb Mar Apr May June July Aug Sept Oct Nov Dec $40 $42 $40 $38 $48 $50 $58 $62 $56 $46 $44 $44 6. Write the formula for the mean water bill for the entire year using sigma notation and determine that mean. Round your answer to the nearest cent.arrow_forward4. The data below represent the number of fatal commercial airline incidents in the United States foreach year from 1998–2011. Find the mode.1 2 3 6 0 2 2 3 2 1 2 1 0 0 5. The table shows the list of average high temperatures in degrees Farenheit for each of the month ofthe year on an island country. Find the mode. Month Jan Feb Mar Apr May Jun Jul Aug Sep Oct Nov Dec 81 82 82 83 85 86 87 87 87 86 84 82 6. Five hundred college graduates were asked how much they donate to their alma mater on an annualbasis. Find the mode of the responses. Responses Frequency$500 or more 45Between 0 to $500 150Nothing 275Refused to answer 30 7. The data shows the number of losses by the team that won the NCAA men’s basketball championshipfor the year…arrow_forwardIf a researcher wants to find out the average monthly expenses of all university students in Edmonton, this average would be an example of ________ . a. samplecross out b. statisticcross out c. populationcross out d. parameterarrow_forward
 MATLAB: An Introduction with ApplicationsStatisticsISBN:9781119256830Author:Amos GilatPublisher:John Wiley & Sons Inc
 Probability and Statistics for Engineering and th...StatisticsISBN:9781305251809Author:Jay L. DevorePublisher:Cengage Learning
 Statistics for The Behavioral Sciences (MindTap C...StatisticsISBN:9781305504912Author:Frederick J Gravetter, Larry B. WallnauPublisher:Cengage Learning
 Elementary Statistics: Picturing the World (7th E...StatisticsISBN:9780134683416Author:Ron Larson, Betsy FarberPublisher:PEARSON
 The Basic Practice of StatisticsStatisticsISBN:9781319042578Author:David S. Moore, William I. Notz, Michael A. FlignerPublisher:W. H. Freeman
 Introduction to the Practice of StatisticsStatisticsISBN:9781319013387Author:David S. Moore, George P. McCabe, Bruce A. CraigPublisher:W. H. Freeman