Concept explainers
(a)
Interpretation:
The dodecane,
Concept introduction:
IR spectroscopy is spectroscopic method to identify the structure of organic compounds. When IR is passed through the sample, different bonds vibrate at different frequencies of IR by absorbing IR light. In IR spectrum energy in terms of wavenumber(
As different molecules have different bonds of varying strength so they absorb IR light of different frequencies. This results in different absorption bands in the IR spectrum characteristic to that bond.
IR region is divided into 3 regions, near, mid and far IR region. The mid-IR region extends from
The allowed vibrational energy levels for IR transition is as follows:
Where,
Explanation of Solution
The absorption by a particular bond vibration appears as peak at definite positions in the IR spectrum irrespective of the compound in which they take place.
Frequency of peaks and their intensity is majorly based on the factors as follows:
- Kind of vibration that is whether stretching or bending.
- Bond order
- Electronegativity difference
- Molecular weight
On the basis of peak intensity,
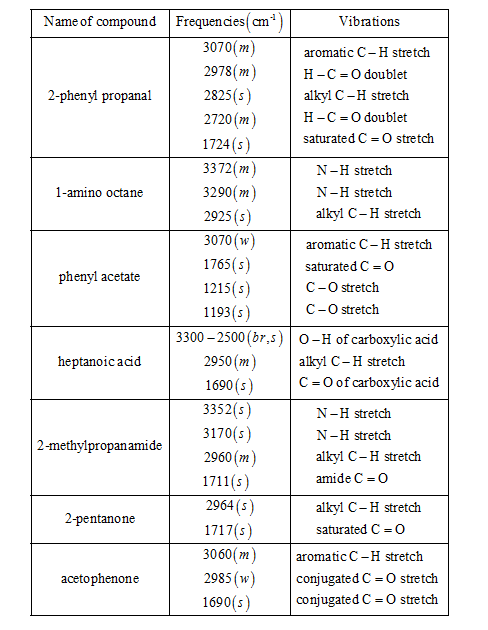
The correct match of the frequencies with the proper compound is tabulated as follows:
(b)
Interpretation:
The phenol, benzyl alcohol, and methoxybenzene should be matched with the correct set of IR frequencies.
Concept introduction:
IR spectroscopy is spectroscopic method to identify the structure of organic compounds. When IR is passed through the sample, different bonds vibrate at different frequencies of IR by absorbing IR light. In IR spectrum energy in terms of wavenumber(
As different molecules have different bonds of varying strength, they absorb IR light of different frequencies. This results in different absorption bands in the IR spectrum characteristic to that bond.
IR region is divided into 3 regions, near, mid and far IR region. The mid-IR region extends from
The allowed vibrational energy levels for IR transition is as follows:
Where,
Explanation of Solution
The absorption by a particular bond vibration appears as peak at definite positions in the IR spectrum irrespective of the compound in which they take place.
Frequency of peaks and their intensity is majorly based on the factors as follows:
- Kind of vibration that is whether stretching or bending.
- Bond order
- Electronegativity difference
- Molecular weight
On the basis of peak intensity,
The correct match of the frequencies with the proper compound is tabulated as follows:
(c)
Interpretation:
The
Concept introduction:
IR spectroscopy is spectroscopic method to identify the structure of organic compounds. When IR is passed through the sample, different bonds vibrate at different frequencies of IR by absorbing IR light. In IR spectrum energy in terms of wavenumber(
As different molecules have different bonds of varying strength so they absorb IR light of different frequencies. This results in different absorption bands in the IR spectrum characteristic to that bond.
IR region is divided into 3 regions, near, mid and far IR region. The mid-IR region extends from
The allowed vibrational energy levels for IR transition is as follows:
Where,
Explanation of Solution
The absorption by a particular bond vibration appears as peak at definite positions in the IR spectrum irrespective of the compound in which they take place.
Frequency of peaks and their intensity is majorly based on the factors as follows:
- Kind of vibration that is whether stretching or bending.
- Bond order
- Electronegativity difference
- Molecular weight
On the basis of peak intensity,
The correct match of the frequencies with the proper compound is tabulated as follows:
Want to see more full solutions like this?
Chapter 21 Solutions
EBK LABORATORY TECHNIQUES IN ORGANIC CH


- Identify and explain the IR absorption characteristics of the unknown C6H14O in the 1400 to 4000 cm-1 range. Then identify the class of the unknown compound C6H14O. At the broad peak I believe it is either an alcohol & phenol or an amine. For the second peak i think it is an alkane.arrow_forwardcan someone provide me with the peaks and data from the IR spectrums in a table 1) table 2) table and also explain both of them to me?arrow_forwardProvide a brief justification for the identification of 1-propanol, hexane, benzyl alcohol, 1-hexanol and ethyl benzoate based on 2-3 key bands in each spectrum, which suggest the presence (or absence) of specific functional groups. You do not need to identify all the bands in the spectra -that would be almost impossible. If the bands are too similar (or in addition, to strengthen your discussion), you could look the IR spectra of the compounds in a database and see whether the IR of the unknowns can be identified this way.arrow_forward
- Fill in the table by matching the numbers of the structure to their corresponding peaks of the C-13 spectra.arrow_forwardThe following are esters derived from acetic acid, each with the formula C5H10O2. Label the peaks to indicate the degree of splitting. Use the integral curve traced on the spectrum to calculate the number of hydrogens for each signal and then determine the structure of the ester.arrow_forwardAnalyze the HNMR for the molecular formula C8H8O3 (vanillin). Propose a table that includes chemical shifts, coupling constant, integration for each peak, assignment of each proton. (assign on structure as well)arrow_forward
- I need help interpreting this IR spectrum of cyclohexanone. I'm not looking for anything in general just a description and explanation of what can be observedarrow_forwardYou are a forensic chemist working in a crime lab. You have received a white powder from investigators that is suspected to be a drug of abuse. Based on the FTIR spectrum, make a decision and justify it based on peak assignments above 1500 cm-1 . Which of the three is it?arrow_forwardPredict the characteristic infrared absorptions of the functional groups in the following molecules. pentanoic acidarrow_forward
- 2. A. Match the following IR spectra with their respective molecules butane, 1-butene, and 1- butyne. Explain your answer. B. Assigned the major peaks in spectra (indicate the positions of vibrational modes belonging to the major functional groups in molecules). C. Calculate the number of vibrational modes in butane.arrow_forward1. Using the following on the positions of peaks in IR spectra and empirical formulas, propose possible structures for the molecules. Express all isomers that match given spectra. Explain the choices. A. C5O2H8 : 3010, 2960, 1650, 1740, 1030, 1430, and 1380 (cm-1 ) B. C8OH8 : 1600, 1680, 2960, 1480, 1380, 755, and 690 (cm-1 ) C. C4H5N : 1650, 2250, 1480, 3010, and 2960 (cm-1 )arrow_forwardThe intensities of peaks at 69 m/z, 70 m/z, and 71 m/z are 1.2, 31.2, and 1.7, respectively. How many carbons does the compound have?arrow_forward
 Organic Chemistry: A Guided InquiryChemistryISBN:9780618974122Author:Andrei StraumanisPublisher:Cengage Learning