
Concept explainers
Videos
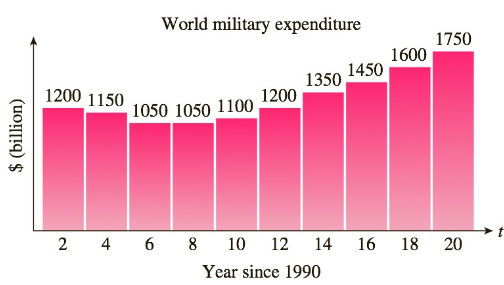
World Military Expenditure The following chart shows total military and arms trade expenditure from 1992–2010 (
Source: www.globalissues.org/Geopolitics/ArmsTrade/Spending.asp.
a. If you want to model the expenditure figures with a function of the form
b. Which of the following models best approximates the data given? (Try to answer this without actually computing values.)
A.
B.
C.
D.
c. What is the nearest year that would correspond to the vertex of the graph of the correct model from part (b)? What is the danger of extrapolating the data in either direction?

Trending nowThis is a popular solution!

Chapter 2 Solutions
Bundle: Applied Calculus, Loose-leaf Version, 7th + Webassign Printed Access Card For Waner/costenoble's Applied Calculus, 7th Edition, Single-term


- A localarrow_forwardAn aerobic exercise instructor submitted to the shipping company the data given in the following table, which shows the recommended maximum exercise heart rates for individuals of the given ages. See table below. If the Chief engineer is 40 years old, predict his maximum exercise heart rate. If your answer has decimal point round it off to two decimal places. Do not put space, comma or unit in your answer. Age (x years) Maximum heart rate(y beats per minute) 20 40 60 170 153 136arrow_forwardComplete Part D A recent issue of the AARP Bulletin reported that the average weekly pay for a woman with a high school degree is $520 (AARP Bulletin, January–February, 2010). Suppose you would like to determine if the average weekly pay for all working women is significantly greater than that for women with a high school degree. Data providing the weekly pay for a sample of 50 working women are available in the file named WeeklyPay. These data are consistent with the findings reported in the AARP article. Complete D null hyposthesis: H(o)=520Alternative hypothesis: H(a): greater then 520 sample mean=637.94 the test statistic = 5.62 p-value=0.00 Using a=.05, we would reject the null hypothesis. D. Repeat the hypothesis test using the critical value approach. 582 333 759 633 629 523 320 685 599 753 553 641 290 800 696 627 679 667 542 619 950 614 548 570 678 697 750 569…arrow_forward
- My UHart | University of Hartford The owner of Showtime Movie Theaters, Inc., would like to predict weekly gross revenue as a function of advertising expenditures. Historical data for a sample of eight weeks follow. Weekly Gross Revenue ($1,000s) Television Advertising ($1,000s) Newspaper Advertising ($1,000s) 96 5.0 1.5 90 2.0 2.0 95 4.0 1.5 92 2.5 2.5 95 3.0 3.3 94 3.5 2.3 94 2.5 4.2 94 3.0 2.5 The owner then used multiple regression analysis to predict gross revenue (y), in thousands of dollars, as a function of television advertising (x,), in thousands of dollars, and newspaper advertising (x,), in thousands of dollars. The estimated regression equation was = 83.2 + 2.29x, + 1.30x2. (a) What is the gross revenue (in dollars) expected for a week when $3,000 is spent on television advertising (x, = 3) and $3,300 is spent on newspaper advertising (x, = 3.3)? (Round your answer to the nearest dollar.) %$4 (b) Provide a 95% confidence interval (in dollars) for the mean revenue of all…arrow_forward. Consumer Prices The data in the table give the consumer price index (CPI) for selected years from 1945to 2009.a. Create a scatter plot of the data, with x equal tothe number of years after 1945. b. What type of function would be best to model thedata? Find the equation of that function. Roundthe coefficient of the cubic term to five decimalplaces.c. Use the function to estimate the CPI in 2015.arrow_forwardWrite a detail note on REGRESSION?arrow_forward
- The U.S. Geological Survey monitors and reports on earthquakes, providing daily real-time, worldwide earthquake lists. Some of the information for four of the 105 earthquakes of magnitude 1.5 or greater that occurred on May 10, 2013, is shown in the following table. Magnitude is given on the Richter scale and NST stands for the number of stations that reported the activity on the same earthquake. Complete parts (a) through (e) below. Time Magnitude Depth (km) NST Region 00:03:16 1.7 75.9 29 Alaska 04:59:11 1.7 134.9 18 Alaska 08:27:04 2.8 64.0 21 Alaska 23:30:09 4.2 10.0 34 China a. Identify the type of data provided by the information in the first column of the table. Also identify the variable under consideration. Quantitative, Continuous, Qualitative, Quantitative, Discrete, region where the earthquake occurred depth of the earthquake in kilometers number of stations reporting the earthquake…arrow_forward. Sketch the graph of the amount of a particular brand of coffee sold by a store as a function of the price of the coffee.arrow_forwardThe scatterplot shows how the pulse rate changes with the weight of a person. Pulse Rate 86.41 - 0.09144(Weight) %3D 100 90 80 70 60 50 100 120 140 160 180 200 220 Pulse Ratearrow_forward
- . Gold Prices The price of an ounce of gold in U.S. dollars for the years 1997–2011 can be modeled by thefunction G(x) = 11.532x2 - 259.978x + 1666.555,where x is the number of years after 1990.a. Graph this function for values of x representing1997–2011.b. According to the model, what will the price ofgold be in 2020?c. Use graphical or numerical methods to estimatewhen the price of gold will reach $2702.80per ounce.arrow_forwardWrite a short note on regression analysisarrow_forwardAnswer part A and D only!arrow_forward
 Algebra & Trigonometry with Analytic GeometryAlgebraISBN:9781133382119Author:SwokowskiPublisher:Cengage
 Glencoe Algebra 1, Student Edition, 9780079039897...AlgebraISBN:9780079039897Author:CarterPublisher:McGraw Hill