
Concept explainers
Videos
a.
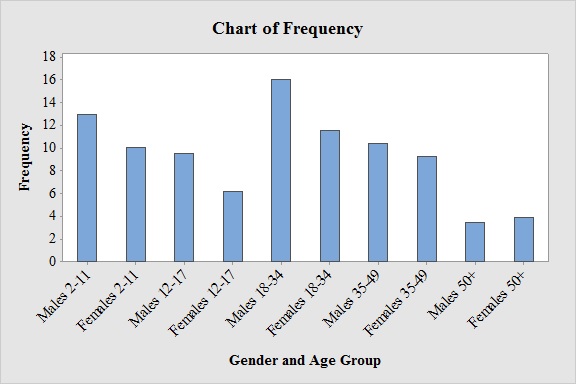
Construct a frequency bar graph.
a.
Answer to Problem 25E
Output obtained from MINITAB software for the gender and age group is:
Explanation of Solution
Calculation:
The given information is a table representing the numbers of people in various gender and age categories who used a video game console.
Software procedure:
- Step by step procedure to draw the bar chart for gender and age group using MINITAB software.
- Choose Graph > Bar Chart.
- From Bars represent, choose unique values from table.
- Choose Simple.
- Click OK.
- In Graph variables, enter the column of Frequency.
- In Categorical variables, enter the column of Gender and Age Group.
- Click OK
Observation:
From the bar graph, it can be seen that Males 18-34 has the highest frequency.
b.
Construct a relative frequency distribution for the data.
b.
Answer to Problem 25E
The relative frequency distribution for the data is:
| Gender and Age Group | Relative Frequency |
| Males 2-11 | 0.139 |
| Females 2-11 | 0.108 |
| Males 12-17 | 0.102 |
| Females 12-17 | 0.066 |
| Males 18-34 | 0.172 |
| Females 18-34 | 0.124 |
| Males 35-49 | 0.111 |
| Females 35-49 | 0.099 |
| Males 50+ | 0.037 |
| Females 50+ | 0.042 |
Explanation of Solution
Calculation:
Relative frequency:
The general formula for the relative frequency is,
Therefore,
Similarly, the relative frequencies for the gender and age group are obtained below:
| Gender and Age Group | Frequency | Relative Frequency |
| Males 2-11 | 13 | |
| Females 2-11 | 10.1 | |
| Males 12-17 | 9.6 | |
| Females 12-17 | 6.2 | |
| Males 18-34 | 16.1 | |
| Females 18-34 | 11.6 | |
| Males 35-49 | 10.4 | |
| Females 35-49 | 9.3 | |
| Males 50+ | 3.5 | |
| Females 50+ | 3.9 | |
| Total | 93.7 |
c.
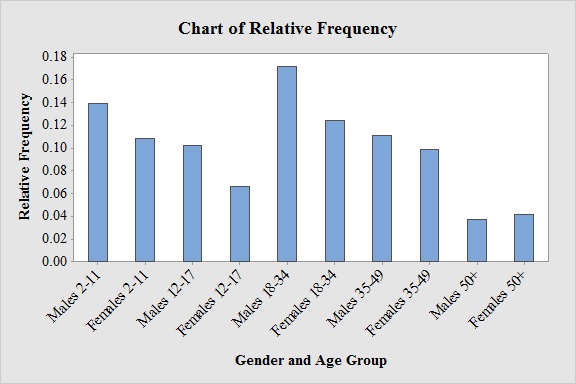
Construct a relative frequency bar graph for these data.
c.
Answer to Problem 25E
Output obtained from MINITAB software for the gender and age group is:
Explanation of Solution
Software procedure:
- Step by step procedure to draw the Bar chart for gender and age group using MINITAB software.
- Choose Graph > Bar Chart.
- From Bars represent, choose unique values from table.
- Choose Simple.
- Click OK.
- In Graph variables, enter the column of Relative Frequency.
- In Categorical variables, enter the column of Gender and Age Group.
- Click OK
Observation:
From the graph, it can be seen that most probable people in the various gender and age categories who used a video game console is Male 18-34 and the least probable people in the various gender and age categories who used a video game console is Male 50+.
d.
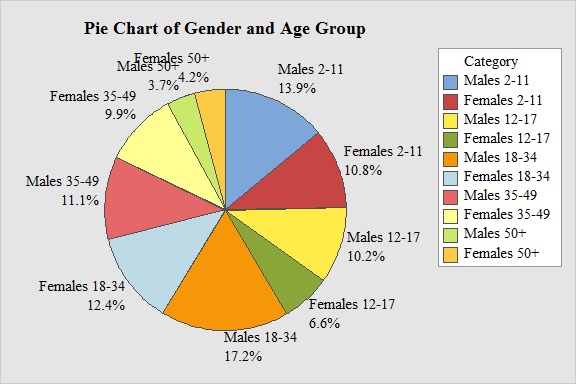
Construct a pie chart.
d.
Answer to Problem 25E
Output obtained from MINITAB software for gender and age group is:
Explanation of Solution
Calculation:
Software procedure:
- Step by step procedure to draw the bar chart for gender and age group using MINITAB software.
- Choose Graph > Pie Chart.
- Choose Chart values from table.
- Under categorical variable, select Gender and Age Group.
- Under Summary variables, select Relative Frequency.
- Click OK.
Observation:
There is about 17.2% of the people in Male 18-34 and the 3.7% of the people in Male 50+.
e.
Identify whether the statement “More than half of video gamers are male” is true or false.
e.
Answer to Problem 25E
The statement “More than half of video gamers are male” is true.
Explanation of Solution
From the pie chart, it can be seen that the percentage of male video gamers are
Hence, the statement “More than half of video gamers are male” is true.
Pie Chart:
It is a circle that divided into sectors one for each category.
g.
Identify whether the statement “More than 40% of video gamers are female” is true or false.
g.
Answer to Problem 25E
The statement “More than 40% of video gamers are female” is true.
Explanation of Solution
From the pie chart, it can be seen that the and the percentage of female video gamers are
Hence, the statement “More than 40% of video gamers are female” is true.
Pie Chart:
It is a circle that divided into sectors one for each category.
h.
Find the proportion of video gamers who are 35 or over.
h.
Answer to Problem 25E
The proportion of video gamers is 35 or over is 0.289.
Explanation of Solution
From the pie chart, it can be seen that the proportion of video gamers that are 35 or over aged are
Hence, the proportion of video gamers is 35 or over is 0.289.
Want to see more full solutions like this?
Chapter 2 Solutions
ESSENTIAL STATISTICS(FD)


 MATLAB: An Introduction with ApplicationsStatisticsISBN:9781119256830Author:Amos GilatPublisher:John Wiley & Sons Inc
 Probability and Statistics for Engineering and th...StatisticsISBN:9781305251809Author:Jay L. DevorePublisher:Cengage Learning
 Statistics for The Behavioral Sciences (MindTap C...StatisticsISBN:9781305504912Author:Frederick J Gravetter, Larry B. WallnauPublisher:Cengage Learning
 Elementary Statistics: Picturing the World (7th E...StatisticsISBN:9780134683416Author:Ron Larson, Betsy FarberPublisher:PEARSON
 The Basic Practice of StatisticsStatisticsISBN:9781319042578Author:David S. Moore, William I. Notz, Michael A. FlignerPublisher:W. H. Freeman
 Introduction to the Practice of StatisticsStatisticsISBN:9781319013387Author:David S. Moore, George P. McCabe, Bruce A. CraigPublisher:W. H. Freeman