
Concept explainers
Videos
Native languages: The following frequency distribution presents the number of households (in thousands) categorized by the language spoken at home, for the cities of New York and Los Angeles in the year 2009. The Total column presents the numbers of households in both cities combined.
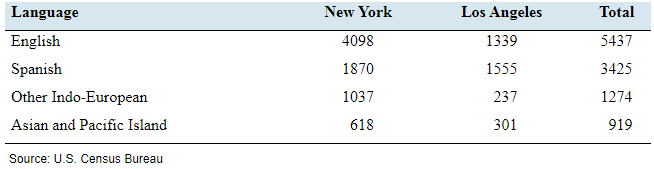
Source: US. Census Bureau
- Construct a frequency bar graph for each city.
- Construct a frequency bar graph for the total.
- Construct a relative frequency bar graph for each city.
- Construct a relative frequency bar graph for the total.
- Explain why the heights of the bars for the frequency bar graph for the total are equal to the sums of the heights for the individual cities.
- Explain why the heights of the bars for the relative frequency bar graph for the total are not equal to the sums of the heights for the individual cities.
a.
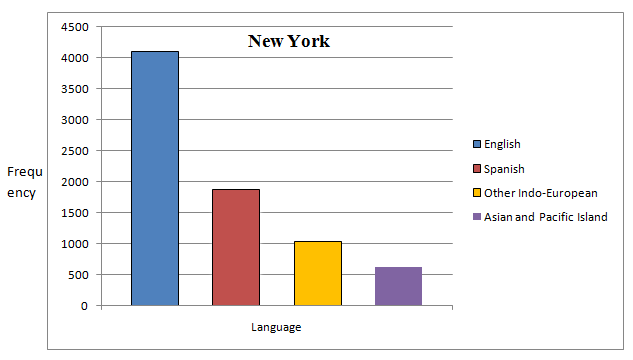
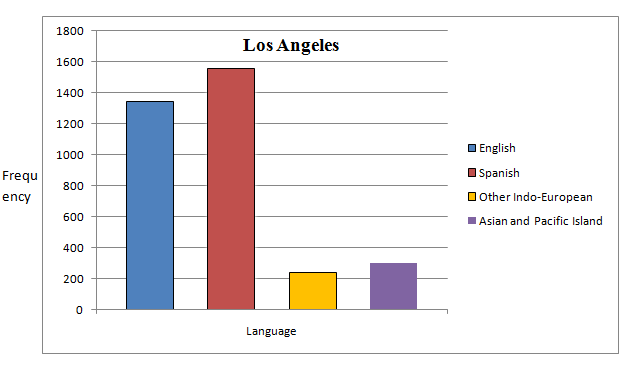
To construct:A frequency bar graph for each city.
Explanation of Solution
Given information:The following frequency distribution presents the number of households (in thousands) categorized by the language spoken at home, for the cities of NewYork and Los An
geles in the year 2009. The total column presents the number of households in both cities combined
| Language | New York | Los Angeles | Total |
| English | 4098 | 1339 | 5437 |
| Spanish | 1870 | 1555 | 3425 |
| Other Indo-European | 1037 | 237 | 1274 |
| Asian and Pacific Island | 618 | 301 | 919 |
.
Solution:
From the given table, the frequency bar graph for New York is given by
The frequency bar graph for Los Angeles is given by
b.
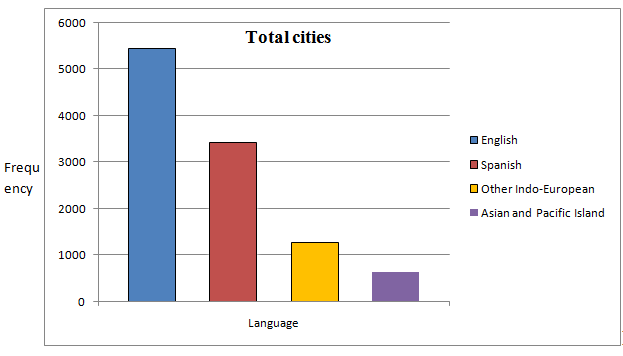
To construct: A frequency bar graph for the total.
Explanation of Solution
Given information: The following frequency distribution presents the number of households (in thousands) categorized by the language spoken at home, for the cities of New York and Los An
geles in the year 2009. The total column presents the number of households in both cities combined
| Language | New York | Los Angeles | Total |
| English | 4098 | 1339 | 5437 |
| Spanish | 1870 | 1555 | 3425 |
| Other Indo-European | 1037 | 237 | 1274 |
| Asian and Pacific Island | 618 | 301 | 919 |
.
Solution:
From the given table, the frequency bar graph for the total is given by
c.
To construct:A relative frequency bar graph for each city.
Explanation of Solution
The following frequency distribution presents the number of households (in thousands) categorized by the language spoken at home, for the cities of New York and Los An
geles in the year 2009. The total column presents the number of households in both cities combined
| Language | New York | Los Angeles | Total |
| English | 4098 | 1339 | 5437 |
| Spanish | 1870 | 1555 | 3425 |
| Other Indo-European | 1037 | 237 | 1274 |
| Asian and Pacific Island | 618 | 301 | 919 |
Formula used:
Solution:
From the given table,
The sum of all frequency for New York city is 7623.
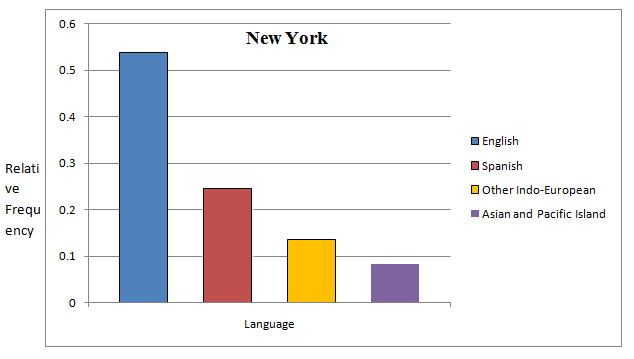
The table of relative frequency for New York city is given by
| Language | New York | Relative Frequency |
| English | 4098 | |
| Spanish | 1870 | |
| Other Indo-European | 1037 | |
| Asian and Pacific Island | 618 |
From the given table, the relative frequency bar graph for New York is given by
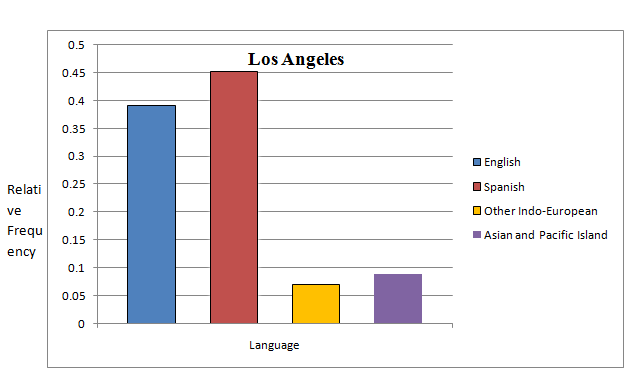
The sum of all frequency for Los Angeles is 3432.
The table of relative frequency for Los Angeles city is given by
| Language | Los Angeles | Relative Frequency |
| English | 1339 | |
| Spanish | 1555 | |
| Other Indo-European | 237 | |
| Asian and Pacific Island | 301 |
The relative frequency bar graph for Los Angeles is given by
d.
To construct: A relative frequency bar graph for the total.
Explanation of Solution
Given information: The following frequency distribution presents the number of households (in thousands) categorized by the language spoken at home, for the cities of New York and Los An
geles in the year 2009. The total column presents the number of households in both cities combined
| Language | New York | Los Angeles | Total |
| English | 4098 | 1339 | 5437 |
| Spanish | 1870 | 1555 | 3425 |
| Other Indo-European | 1037 | 237 | 1274 |
| Asian and Pacific Island | 618 | 301 | 919 |
Formula used:
Solution:
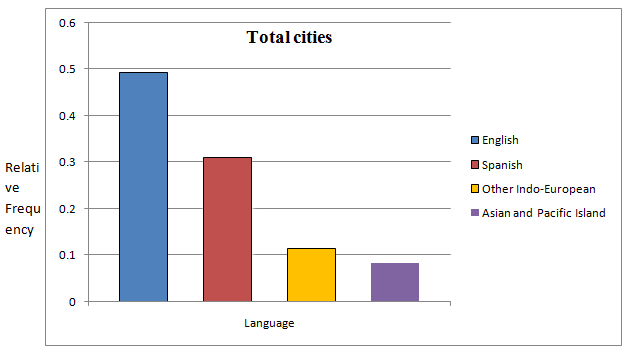
From the given table,
The sum of all frequency for total city is 11055.
The table of relative frequency for New York city is given by
| Language | Total | Relative Frequency |
| English | 5437 | |
| Spanish | 3425 | |
| Other Indo-European | 1274 | |
| Asian and Pacific Island | 919 |
From the given table, the relative frequency bar graph for the total is given by
e.
To explain: The heights of the bars for the frequency bar graph for the total are equal to the sum of the heights for the individual cities.
Explanation of Solution
Given information: The following frequency distribution presents the number of households (in thousands) categorized by the language spoken at home, for the cities of New York and Los An
geles in the year 2009. The total column presents the number of households in both cities combined
| Language | New York | Los Angeles | Total |
| English | 4098 | 1339 | 5437 |
| Spanish | 1870 | 1555 | 3425 |
| Other Indo-European | 1037 | 237 | 1274 |
| Asian and Pacific Island | 618 | 301 | 919 |
Since each total frequency of households is the sum of the frequencies for the cities of New York and Los Angeles, therefore, the heights of the bars for the frequency bar graph for the total are equal to the sum of the heights for the individual cities.
f.
To explain: The heights of the bars for the relative frequency bar graph for the total are not equal to the sum of the heights for the individual cities.
Explanation of Solution
Given information: The following frequency distribution presents the number of households (in thousands) categorized by the language spoken at home, for the cities of New York and Los An
geles in the year 2009. The total column presents the number of households in both cities combined
| Language | New York | Los Angeles | Total |
| English | 4098 | 1339 | 5437 |
| Spanish | 1870 | 1555 | 3425 |
| Other Indo-European | 1037 | 237 | 1274 |
| Asian and Pacific Island | 618 | 301 | 919 |
The relative frequency is the frequency divided by the sum of all frequency.
The sum of all frequencies for each city is not equal to the sum of all total frequencies; therefore, the sum of relative frequency for each city will not be equal to the relative frequency for total.
Hence, the heights of the bars for the relative frequency bar graph for the total are not equal to the sum of the heights for the individual cities.
Want to see more full solutions like this?
Chapter 2 Solutions
Elementary Statistics 2nd Edition


 Glencoe Algebra 1, Student Edition, 9780079039897...AlgebraISBN:9780079039897Author:CarterPublisher:McGraw Hill
 Holt Mcdougal Larson Pre-algebra: Student Edition...AlgebraISBN:9780547587776Author:HOLT MCDOUGALPublisher:HOLT MCDOUGAL