
Videos
Hail to the chief: There have been 58 presidential inaugurations in U.S. history. At each one, the president has made an inaugural address. Following are the number of words spoken in each of these addresses.
- Construct a frequency distribution with approximately five classes.
- Construct a frequency histogram from the frequency distribution in part (a).
- Construct a relative frequency distribution using the same classes as in part (a).
- Construct a relative frequency histogram from this relative frequency distribution.
- Are the histograms skewed to the left, skewed to the right, or approximately symmetric?
- Construct a frequency distribution with approximately nine classes.
- Repeat parts (b)—(d), using the frequency distribution constructed in part (f).
- Do you think that five and nine classes are both reasonably good choices for these data, or do you think that one choice is much better than the other? Explain your reasoning.
a.
To construct:A frequency distribution with approximately 5 classes.
Explanation of Solution
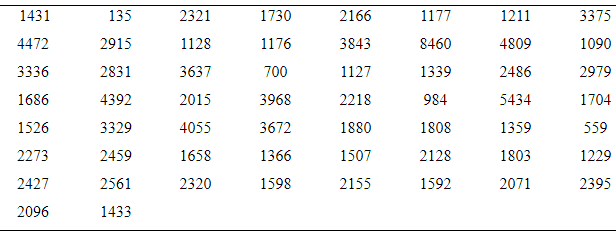
Given information:There have been 58 presidential inaugurations in U.S. history. At each one, the president has made an inaugural address. Following are the number of words spoken in each of these addresses.
| 1431 | 135 | 2321 | 1730 | 2166 | 1177 | 1211 | 3375 |
| 4472 | 2915 | 1128 | 1176 | 3843 | 8460 | 4809 | 1090 |
| 3336 | 2831 | 3637 | 700 | 1127 | 1339 | 2486 | 2979 |
| 1686 | 4392 | 2015 | 3968 | 2218 | 984 | 5434 | 1704 |
| 1526 | 3329 | 4055 | 3672 | 1880 | 1808 | 1359 | 559 |
| 2273 | 2459 | 1658 | 1366 | 1507 | 2128 | 1803 | 1229 |
| 2427 | 2561 | 2320 | 1598 | 2155 | 1592 | 2071 | 2395 |
| 2096 | 1433 |
Definition used: Frequency distributions for quantitative data are just like those for qualitative data, except the data are divided into classes rather categories.
Solution:
The class width is 2000. The minimum and maximum values of the ratings are 0 and 9999.
The table of frequency distribution is given by
| Number of words | Frequency |
| 0-1999 | 27 |
| 2000-3999 | 25 |
| 4000-5999 | 5 |
| 6000-7999 | 0 |
| 8000-9999 | 1 |
b.
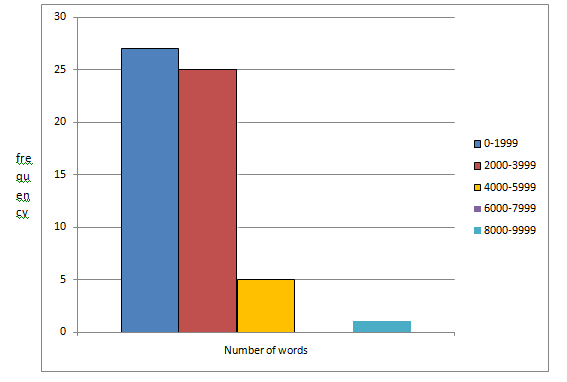
To construct:A frequency histogram from the frequency distribution.
Explanation of Solution
Given information:The table of frequency distribution is given by
| Number of words | Frequency |
| 0-1999 | 27 |
| 2000-3999 | 25 |
| 4000-5999 | 5 |
| 6000-7999 | 0 |
| 8000-9999 | 1 |
Definition used: Histograms based on frequency distributions are called frequency histogram.
Solution:
The frequency histogram for the given data is given by
c.
To construct: A relative frequency distribution.
Explanation of Solution
Given information:The table of frequency distribution is given by
| Number of words | Frequency |
| 0-1999 | 27 |
| 2000-3999 | 25 |
| 4000-5999 | 5 |
| 6000-7999 | 0 |
| 8000-9999 | 1 |
Formula used:
Solution:
From the given table,
The sum of all frequency is
The table of relative frequency is given by
| Number of words | Frequency | Relative frequency |
| 0-1999 | 27 | |
| 2000-3999 | 25 | |
| 4000-5999 | 5 | |
| 6000-7999 | 0 | |
| 8000-9999 | 1 |
d.
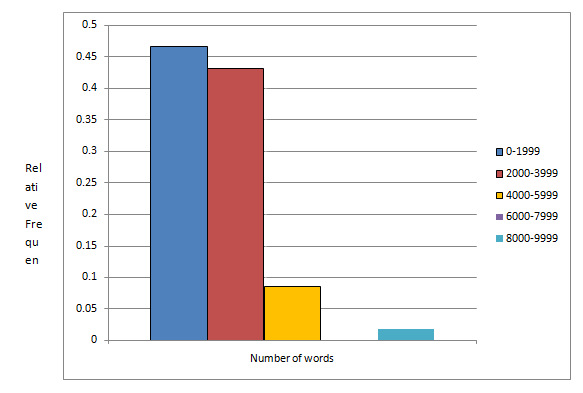
To construct: A relative frequency histogram.
Explanation of Solution
Given information:There have been 58 presidential inaugurations in U.S. history. At each one, the president has made an inaugural address. Following are the number of words spoken in each of these addresses.
| 1431 | 135 | 2321 | 1730 | 2166 | 1177 | 1211 | 3375 |
| 4472 | 2915 | 1128 | 1176 | 3843 | 8460 | 4809 | 1090 |
| 3336 | 2831 | 3637 | 700 | 1127 | 1339 | 2486 | 2979 |
| 1686 | 4392 | 2015 | 3968 | 2218 | 984 | 5434 | 1704 |
| 1526 | 3329 | 4055 | 3672 | 1880 | 1808 | 1359 | 559 |
| 2273 | 2459 | 1658 | 1366 | 1507 | 2128 | 1803 | 1229 |
| 2427 | 2561 | 2320 | 1598 | 2155 | 1592 | 2071 | 2395 |
| 2096 | 1433 |
Definition used: Histograms based on relative frequency distributions are called relative frequency histogram.
Solution:
| Number of words | Relative Frequency |
| 0-1999 | 0.466 |
| 2000-3999 | 0.431 |
| 4000-5999 | 0.086 |
| 6000-7999 | 0.000 |
| 8000-9999 | 0.017 |
Therelative frequency histogram for the given data is given by
e.
To find: Whether the histograms are skewed to the right, skewed to the left, or approximately symmetric.
Answer to Problem 31E
The histogram is skewed to the right.
Explanation of Solution
Given information:There have been 58 presidential inaugurations in U.S. history. At each one, the president has made an inaugural address. Following are the number of words spoken in each of these addresses.
| 1431 | 135 | 2321 | 1730 | 2166 | 1177 | 1211 | 3375 |
| 4472 | 2915 | 1128 | 1176 | 3843 | 8460 | 4809 | 1090 |
| 3336 | 2831 | 3637 | 700 | 1127 | 1339 | 2486 | 2979 |
| 1686 | 4392 | 2015 | 3968 | 2218 | 984 | 5434 | 1704 |
| 1526 | 3329 | 4055 | 3672 | 1880 | 1808 | 1359 | 559 |
| 2273 | 2459 | 1658 | 1366 | 1507 | 2128 | 1803 | 1229 |
| 2427 | 2561 | 2320 | 1598 | 2155 | 1592 | 2071 | 2395 |
| 2096 | 1433 |
Definition used:
A histogram which has a long right-hand tail is said to be skewed to the right.
A histogram which has a long left-hand tail is said to be skewed to the left.
A histogram is symmetric if its right half is a minor image of its left half.
Solution:
The frequency histogram for the given data is given by
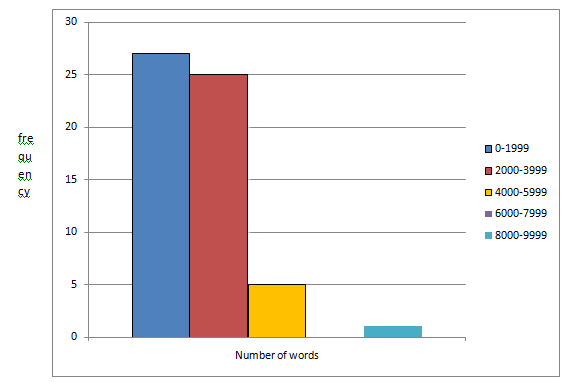
The above histogram has a right-hand tail; therefore, it is skewed to the right.
Hence, the histogram is skewed to the right.
f.
To construct: A frequency distribution with approximately 9 classes.
Explanation of Solution
Given information: There have been 58 presidential inaugurations in U.S. history. At each one, the president has made an inaugural address. Following are the number of words spoken in each of these addresses.
| 1431 | 135 | 2321 | 1730 | 2166 | 1177 | 1211 | 3375 |
| 4472 | 2915 | 1128 | 1176 | 3843 | 8460 | 4809 | 1090 |
| 3336 | 2831 | 3637 | 700 | 1127 | 1339 | 2486 | 2979 |
| 1686 | 4392 | 2015 | 3968 | 2218 | 984 | 5434 | 1704 |
| 1526 | 3329 | 4055 | 3672 | 1880 | 1808 | 1359 | 559 |
| 2273 | 2459 | 1658 | 1366 | 1507 | 2128 | 1803 | 1229 |
| 2427 | 2561 | 2320 | 1598 | 2155 | 1592 | 2071 | 2395 |
| 2096 | 1433 |
Definition used: Frequency distributions for quantitative data are just like those for qualitative data, except the data are divided into classes rather categories.
Solution:
Let us take the class width is 1000. The minimum and maximum values of the ratings are 0 and 8999.
The table of frequency distribution is given by
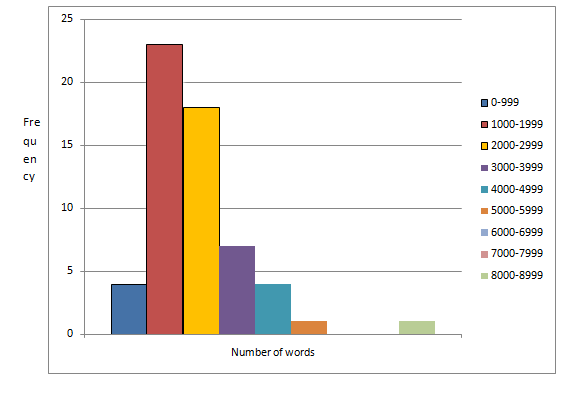
| Number of words | Frequency |
| 0-999 | 4 |
| 1000-1999 | 23 |
| 2000-2999 | 18 |
| 3000-3999 | 7 |
| 4000-4999 | 4 |
| 5000-5999 | 1 |
| 6000-6999 | 0 |
| 7000-7999 | 0 |
| 8000-8999 | 1 |
g.
To construct: A frequency histogram, relative frequency distribution and relative frequency histogram.
Explanation of Solution
Given information: The table of frequency distribution is given by
| Number of words | Frequency |
| 0-999 | 4 |
| 1000-1999 | 23 |
| 2000-2999 | 18 |
| 3000-3999 | 7 |
| 4000-4999 | 4 |
| 5000-5999 | 1 |
| 6000-6999 | 0 |
| 7000-7999 | 0 |
| 8000-8999 | 1 |
Solution:
The frequency histogram for the given data is given by
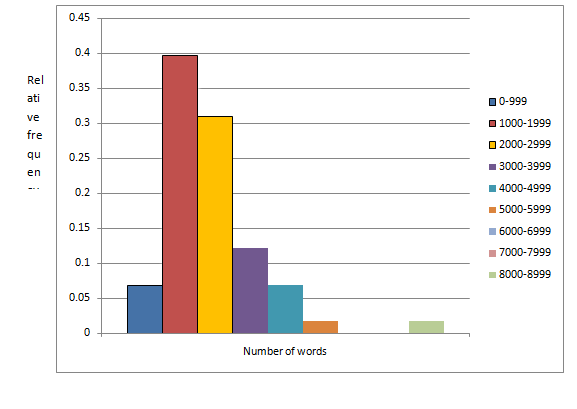
The sum of all frequency is 58
The relative frequency distribution table is given by
| Number of words | Frequency | Relative frequency |
| 0-999 | 4 | |
| 1000-1999 | 23 | |
| 2000-2999 | 18 | |
| 3000-3999 | 7 | |
| 4000-4999 | 4 | |
| 5000-5999 | 1 | |
| 6000-6999 | 0 | |
| 7000-7999 | 0 | |
| 8000-8999 | 1 |
The relative frequency histogram for the given data is given by
g.
To explain: Whether the good choices for the data are that classes with 5 or 9.
Answer to Problem 31E
The one with 9 classes is the good choice than 5 classes
Explanation of Solution
Given information:There have been 58 presidential inaugurations in U.S. history. At each one, the president has made an inaugural address. Following are the number of words spoken in each of these addresses.
| 1431 | 135 | 2321 | 1730 | 2166 | 1177 | 1211 | 3375 |
| 4472 | 2915 | 1128 | 1176 | 3843 | 8460 | 4809 | 1090 |
| 3336 | 2831 | 3637 | 700 | 1127 | 1339 | 2486 | 2979 |
| 1686 | 4392 | 2015 | 3968 | 2218 | 984 | 5434 | 1704 |
| 1526 | 3329 | 4055 | 3672 | 1880 | 1808 | 1359 | 559 |
| 2273 | 2459 | 1658 | 1366 | 1507 | 2128 | 1803 | 1229 |
| 2427 | 2561 | 2320 | 1598 | 2155 | 1592 | 2071 | 2395 |
| 2096 | 1433 |
The one with 9 classes is more appropriate than the one with only 5 classes.
This is because the one with only 5 classes is too wide and only the most basic features of the data are visible.
Hence, the one with 9 classes is the good choice than 5 classes.
Want to see more full solutions like this?
Chapter 2 Solutions
Elementary Statistics 2nd Edition


 Glencoe Algebra 1, Student Edition, 9780079039897...AlgebraISBN:9780079039897Author:CarterPublisher:McGraw Hill