Concept explainers
Videos
Slopes of Secant Lines In Exercises 3 and 4, use the graph shown in the figure. To print an enlarged copy of the graph, go to MathGraphs.com.
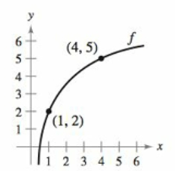
Identify or sketch each of the quantities on the figure.
(a)
(b)
(c)

Trending nowThis is a popular solution!

Chapter 2 Solutions
Calculus


- Population The population y (in thousands) of Buffalo, New York, from 2000 to 2014 can be approximated by the model y=2.60t+291.7,0t14, where t represents the year, with t=0 corresponding to 2000 (see figure). (a) Graphically estimate the y-intercept of the graph. (b) Find algebraically and interpret the y-intercept of the graph. (c) Use the model to predict the year in which the population will be 239,000. Does your answer seem reasonable? Explain.arrow_forwardPopulation Statistics The table shows the life expectancies of a child (at birth) in the United States for selected years from 1940 through 2010. A model for the life expectancy during this period is y=63.6+0.97t1+0.01t,0t70 Where y represents the life expectancy and t is the time in years, with t = 0 corresponding to 1940. (a) Use a graphing utility to graph the data from the table and the model in the same viewing window. How well does the model fit the data? Explain. (b) Determine the life expectancy in 1990 both graphically and algebraically. (c) Use the graph to determine the year when life expectancy was approximately 70.1. verify your answer algebraically. (d) Find the y-intercept of the graph of the model. What does it represent in the context of the problem? (e) Do you think this model can be used to predict the life expectancy of a child 50 years from now?arrow_forwardPopulation The population y (in thousands) of Raleigh, North Carolina, from 2000 to 2014 can be approximated by the model y=11.09t+293.4,0t14, where t represents the year, with t=0 corresponding to 2000 (see figure). (a) Graphically estimate the y-intercept of the graph. (b) Find algebraically and interpret the y-intercept of the graph. (c) Use the model to predict the year in which the population will be 538,000. Does your answer seem reasonable? Explain.arrow_forward
- Technology Exercise: a. Use a graphing utility to graph f(x) = x2 + 1. b. Graph f(x) = x2 + 1, g(x) = f(1/2)x, and h(x) = f(1/4)x in the same viewing rectangle. c. Describe the relationship among the graphs of f, g, and h, with emphasis on different values of x for points on all three graphs that give the same y-coordinate. d. Generalize by describing the relationship between the graph of f and the graph of g, where g(x) = f(cx) for 0 < c < 1. e. Try out your generalization by sketching the graphs of f(cx) for c = 1, and c = 1/2 , and c = 1/4 for a function of your choice.arrow_forwardSlope of a line Consider the line ƒ(x) = mx + b, where m and bare constants. Show that ƒ′(x) = m for all x. Interpret this resultarrow_forwardSlopes on a circle Find the slopes of the lines tangent to the circler = ƒ(θ) = 10.arrow_forward
 Algebra & Trigonometry with Analytic GeometryAlgebraISBN:9781133382119Author:SwokowskiPublisher:Cengage
 College Algebra (MindTap Course List)AlgebraISBN:9781305652231Author:R. David Gustafson, Jeff HughesPublisher:Cengage Learning
 Algebra and Trigonometry (MindTap Course List)AlgebraISBN:9781305071742Author:James Stewart, Lothar Redlin, Saleem WatsonPublisher:Cengage Learning
 College AlgebraAlgebraISBN:9781305115545Author:James Stewart, Lothar Redlin, Saleem WatsonPublisher:Cengage Learning
 Functions and Change: A Modeling Approach to Coll...AlgebraISBN:9781337111348Author:Bruce Crauder, Benny Evans, Alan NoellPublisher:Cengage Learning