Concept explainers
Videos
CBSSports.com developed the Total Player Ratings system to rate players in the National Basketball Association (NBA) based upon various offensive and defensive statistics. The following data show the average number of points scored per game (PPG) for 50 players with the highest ratings for a portion of the 2012—2013 NBA season (CBSSports.com website, February 25, 2013).
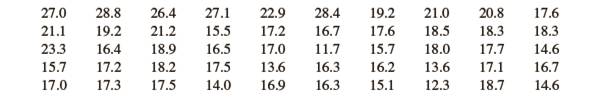
Use classes starting at 10 and ending at 30 in increments of 2 for PPG in the following.
a. Show the frequency distribution.
b. Show the relative frequency distribution.
c. Show the cumulative percent frequency distribution.
d. Develop a histogram for the average number of points scored per game.
e. Do the data appear to be skewed? Explain.
f. What percentage of the players averaged at least 20 points per game?
Want to see the full answer?
Check out a sample textbook solution
Chapter 2 Solutions
Bundle: Essentials of Modern Business Statistics with Microsoft Office Excel, Loose-leaf Version, 7th + LMS Integrated for MindTap Business Statistics, 1 term (6 months) Printed Access Card


 Glencoe Algebra 1, Student Edition, 9780079039897...AlgebraISBN:9780079039897Author:CarterPublisher:McGraw Hill
 Holt Mcdougal Larson Pre-algebra: Student Edition...AlgebraISBN:9780547587776Author:HOLT MCDOUGALPublisher:HOLT MCDOUGAL
 Big Ideas Math A Bridge To Success Algebra 1: Stu...AlgebraISBN:9781680331141Author:HOUGHTON MIFFLIN HARCOURTPublisher:Houghton Mifflin Harcourt
 Algebra: Structure And Method, Book 1AlgebraISBN:9780395977224Author:Richard G. Brown, Mary P. Dolciani, Robert H. Sorgenfrey, William L. ColePublisher:McDougal Littell