Concept explainers
Videos
The Northwest regional manager of an outdoor equipment retailer conducted a study to determine how managers at three store locations are using their time. A summary of the results is shown in the following table. 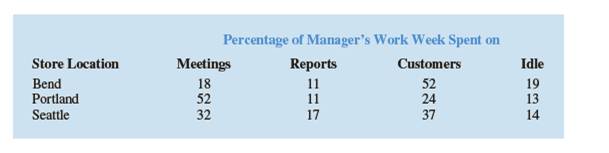
a. Create a stacked bar chart with store location on the horizontal axis and percentage of time spent on each task on the vertical axis.
b. Create a side-by-side bar chart with store location on the horizontal axis and side-by-side bars of the percentage of time spent on each task.
c. Which type of bar chart (stacked or side-by-side) do you prefer for these data? Why?
Want to see the full answer?
Check out a sample textbook solution
Chapter 2 Solutions
Bundle: Essentials of Modern Business Statistics with Microsoft Office Excel, Loose-leaf Version, 7th + LMS Integrated for MindTap Business Statistics, 1 term (6 months) Printed Access Card


 Glencoe Algebra 1, Student Edition, 9780079039897...AlgebraISBN:9780079039897Author:CarterPublisher:McGraw Hill
 Holt Mcdougal Larson Pre-algebra: Student Edition...AlgebraISBN:9780547587776Author:HOLT MCDOUGALPublisher:HOLT MCDOUGAL
 Big Ideas Math A Bridge To Success Algebra 1: Stu...AlgebraISBN:9781680331141Author:HOUGHTON MIFFLIN HARCOURTPublisher:Houghton Mifflin Harcourt