Videos
To review:
On the basis of the given data, we are required to show the patterns of the hydrocarbons which are consistent with reinforcement.
Given:
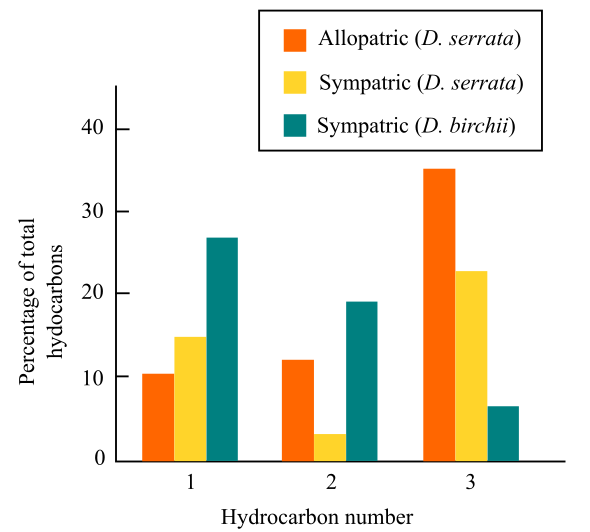
The graph given below shows the hydrocarbon concentration in the cuticle of allopatric and sympatric species of three species of Drosophila.
Introduction:
A study was conducted on the east coast of Australia, where two species of Drosophila, D. serrata and D. birchii, coexist and breed to produce hybrids. The hydrocarbon concentration in the allopatric and sympatric species was estimated to see the differences in them. The reinforcement mechanism was assumed to be the reason for such differences in the species.
Explanation of Solution
Reinforcement theory for
After studying the data given, the hydrocarbon 2 show a pattern, which is consistent with reinforcement. For reinforcement to be consistent, one needs to check the difference between the sympatric population and the other species, which should be greater than the difference between the allopatric populations and other species.
In case a barrier in gene flow is established, the reproduction isolation will begin by genetic divergence. Due to this, there are differences accumulated in the lineages. This reduces the probability of individuals mating with each other successfully, whenever they come into contact.
In case this isolation fails when the species come into contact, then some hybridization is bound to occur. The selection of the species will favor the parents. Due to this, the selection will result in the reinforcement of the mechanisms that prevent hybridization.
Therefore, it can be concluded that hydrocarbon 2 shows the correct pattern of reinforcement.
Want to see more full solutions like this?
Chapter 22 Solutions
EBK LIFE: THE SCIENCE OF BIOLOGY


- Describe one way that the "nature and nurture" theme is represented in core-knowledge theories. Provide an example to support your responsearrow_forwardThe question is in the photos thanksarrow_forwardMake a graph in Excel using the data ( the image ) This data represents results from a fictional study comparing bee body weight to insecticide exposure. a. Tittleb. The graph can be any style or format but must display a relationship between the independent (x axis) and dependent (y axis) variables.c. Both axis of the graph must be correctly labeled, including correct units, andrepresent the independent and dependent variables.d. The graph must contain a trendline with a trendline equation and R2 valuearrow_forward
- Colton is having an ant problem at his house and heard that adding more cinnamon throughout his home may repel and reduce the number of ants that enter. He wants to design an experiment to determine the relationship between cinnamon and ants. What is the best testable research question for Colton's experiment? A. How does the number of ants entering a home change throughout the day? B. What spices affect ants? C. Do ants like cinnamon? D. How does the amount of cinnamon in a home affect the number of ants entering? What's the independent variable/Dependent variable/ controlled variable?arrow_forwardExplain Hardy-Weinberg Law in veterinary science.arrow_forwardYou want to test whether a pesticide effectively controls (kills) yam beetles. You have access to the plants yam beetles eat, a greenhouse, the pesticide and yam beetles. How would you set up your experiment to determine if the pesticide could effectively kill the beetles? (Hint: think of your variables, what are some variable you'd control? what would you manipulate/vary? what would you measure?)arrow_forward
- In your own understanding, answer the following questions: 1. Are leaders born or can they be trained?2. Leaders are made, not born. Explainarrow_forwarda) Does the data support your hypothesis? b) How could you improve this experiment? Consider the other factors you could have / should have controlled in this experiment.arrow_forwardDemonstrate your knowledge and understanding of ONE reflective model. You may choose from either. Gibbs’ Reflective Cycle (1998) OR Rolfe, Freshwater & Jasper (2001) Choose one reflective model from the above choices and analyse what is good and not so good about the reflective model.arrow_forward
- For your summer research project, you decide to repeat Lillian Tuttle’s (2017) experiment testing the effect of lionfish on other fish that are cleaners and clients. You do this new experiment at a new location (Bonaire), but use basically the same experimental approach and BACI design as Tuttle. a) You do not separate resident and transient clients (as Tuttle did), and below is a graph of your results showing the effect of the treatment on the total density of client fish in the community. Please explain your result. Imagine that you are planning to publish your experiment and that your answer to this question will be part of the “Results” section of your paper. Please do not worry about hypothetical statistical tests; just assume that the obvious patterns displayed in the graph can be interpreted at face value.arrow_forwardGive the clear handwritten answer..asaparrow_forwardAnswer as comprehensively and as briefly as you can. 1. When is a hypothesis accepted? 2. Why is a variable included in an experiment? 3. Discuss the importance of a control in interpreting the results of an experiment.arrow_forward
 Case Studies In Health Information ManagementBiologyISBN:9781337676908Author:SCHNERINGPublisher:Cengage
 Concepts of BiologyBiologyISBN:9781938168116Author:Samantha Fowler, Rebecca Roush, James WisePublisher:OpenStax College
 Biology (MindTap Course List)BiologyISBN:9781337392938Author:Eldra Solomon, Charles Martin, Diana W. Martin, Linda R. BergPublisher:Cengage Learning
 Principles Of Radiographic Imaging: An Art And A ...Health & NutritionISBN:9781337711067Author:Richard R. Carlton, Arlene M. Adler, Vesna BalacPublisher:Cengage LearningEssentials Health Info Management Principles/Prac...Health & NutritionISBN:9780357191651Author:BowiePublisher:Cengage