- Change in the inflation rate over the four most recent quarters of data available and the four quarters prior to that
- Changes in the net wages above productivity, the
price of oil and inflation expectations over the four most recent quarters of data available and the four quarters prior to that
- The answers to part a and part b using short-run
aggregate supply curves.
Explanation of Solution
Data:
- Personal Consumption Expenditure Price Index - PCE: A measure of Price Level
- Net Wages Above Productivity - NWAP: Compensation − Productivity
- Compensation - Comp: Real Compensation Per Hour
- Productivity- Prod. : Non-Farm Business Sector Real Output Per Hour
- Inflation Expectations - IE: MICH
- Price of Parallel of Oil: PBO
Spreadsheet:
| Year | PCE | Change in Levels of PCE | Change in Inflation Rate % | Comp. | Prod. | NWAP | Change in Level of NWAP | Change in Level of NWAP % | PBO | Change in Level of PBO | Change in Level of PBO % | IE | Change in Level of IE | Change in Level of IE % |
| 2016 Q1 jan | 109.9 | 103.4 | 106.4 | -3 | 31.6 | 2.5 | ||||||||
| 2016 Q2 apr | 110.5 | 103.9 | 106.6 | -2.7 | 40.7 | 2.8 | ||||||||
| 2016 Q3 july | 111 | 104.1 | 107.3 | -3.2 | 44.6 | 2.7 | ||||||||
| 2016 Q4 oct | 111.5 | 102.2 | 107.6 | -5.4 | 49.7 | 2.4 | ||||||||
| 2017 Q1 jan | 112.1 | 2.2 | 2.00 | 102.7 | 107.6 | -4.9 | -1.9 | 63.33 | 52.5 | 20.9 | 66.14 | 2.6 | 0.1 | 4.00 |
| 2017 Q2 apr | 112.2 | 1.7 | 1.54 | 102.8 | 108.1 | -5.3 | -2.6 | 96.30 | 51 | 10.3 | 25.31 | 2.5 | -0.3 | -10.71 |
| 2017 Q3 july | 112.6 | 1.6 | 1.44 | 103.2 | 108.8 | -5.6 | -2.4 | 75.00 | 46.6 | 2 | 4.48 | 2.6 | -0.1 | -3.70 |
| 2017 Q4 oct | 113.4 | 1.9 | 1.70 | 103 | 108.9 | -5.9 | -0.5 | 9.26 | 51.5 | 1.8 | 3.62 | 2.4 | 0 | 0.00 |
*St. Louis Reserve Fred Database
Interpretation: Findings from above Table
- Inflation Rate: Continuously Declining
- Cost of Inputs: Declining
- Labour Productivity: First Increasing and then Declining
- Inflation Expectations: Declining
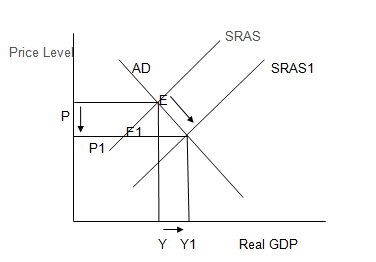
A fall in oil prices (and a fall in firms costs) will shift the short-run aggregate supply (SRAS) to the right, causing lower inflation and higher real
The declining inflation expectations meet the declining inflation rate due to a rightward shift in aggregate supply.
If we expect prices to decline in future, the demand for wages declines and so firms reduce their prices. Thus the short term supply [SRAS] would increase.
Introduction:
Aggregate or Total Supply, otherwise called as total yield, is the aggregate supply of products and services delivered inside an economy at a given general price level in a given period. It is depicted by the total supply curve, which indicates the connection between price levels and the amount of yield that organizations will provide. Normally, there is a positive connection between total supply and the price level.
A shift in total supply can be ascribed to various factors. These incorporate changes in the size and nature of work, mechanical developments, technological advancements, an expansion in compensation, an expansion underway costs, changes in producer taxes, subsidies and changes in inflation. A portion of these elements prompts positive changes in total supply while others make total supply decrease.
Want to see more full solutions like this?
Chapter 23 Solutions
Economics of Money, Banking and Financial Markets, The, Business School Edition (5th Edition) (What's New in Economics)


 Principles of Economics (12th Edition)EconomicsISBN:9780134078779Author:Karl E. Case, Ray C. Fair, Sharon E. OsterPublisher:PEARSON
 Engineering Economy (17th Edition)EconomicsISBN:9780134870069Author:William G. Sullivan, Elin M. Wicks, C. Patrick KoellingPublisher:PEARSON
 Principles of Economics (MindTap Course List)EconomicsISBN:9781305585126Author:N. Gregory MankiwPublisher:Cengage Learning
 Managerial Economics: A Problem Solving ApproachEconomicsISBN:9781337106665Author:Luke M. Froeb, Brian T. McCann, Michael R. Ward, Mike ShorPublisher:Cengage Learning
 Managerial Economics & Business Strategy (Mcgraw-...EconomicsISBN:9781259290619Author:Michael Baye, Jeff PrincePublisher:McGraw-Hill Education