
Videos
(a)
To construct: The stemplot for Diabetic Mice and Normal Mice.
To check: Whether it appears that potentials in the two groups differ in a systematic way or not.
(a)
Answer to Problem 24.58SE
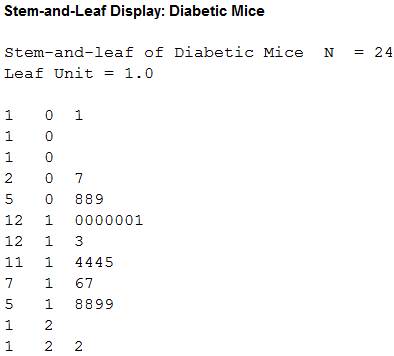
Stemplot for Diabetic Mice:
Output using the MINITAB software is given below:
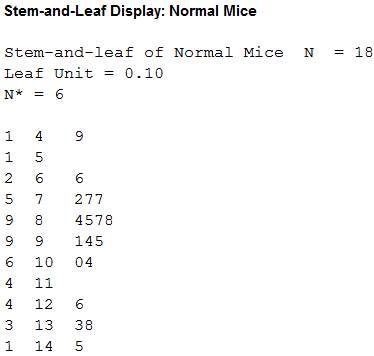
Stemplot for Normal Mice:
Output using the MINITAB software is given below:
Yes, it appears that potentials in the two groups differ in a systematic way.
Explanation of Solution
Given info:
The data shows the measured the difference in electrical potential between the Diabetic Mice and Normal Mice.
Calculation:
Stemplot for Diabetic Mice:
Software procedure:
Step by step procedure to construct Stemplot for Diabetic Mice by using the MINITAB software:
- Choose Graph > Stem-and-Leaf.
- In Graph variables, enter the column of Diabetic Mice.
- Click OK.
Observation:
From Stemplot for Diabetic Mice, it is clear that the left side of the stemplot extended larger than the right side of the stemplot. Hence, the distribution of the Diabetic Mice is left-skewed with one low outlier.
Stemplot for Normal Mice:
Software procedure:
Step by step procedure to construct Stemplot for Normal Mice by using the MINITAB software:
- Choose Graph > Stem-and-Leaf.
- In Graph variables, enter the column of Normal Mice.
- Click OK.
Observation:
From Stemplot for Normal Mice, it is clear that the right side of the stemplot extended same as in the left side of the stemplot. Hence, the distribution of the Normal Mice is symmetric.
Justification:
From the Stemplot for Diabetic Mice and Normal Mice, it can be observed that the distribution of the two groups is symmetric without considering the outliers. Hence, it appears that potentials in the two groups differ in a systematic way.
(b)
To test: Whether there is a significant difference in mean potentials between the two groups or not.
(b)
Answer to Problem 24.58SE
The conclusion is that, there is a significant difference in mean potentials between the two groups.
Explanation of Solution
Calculation:
PLAN:
Check whether or not there is a significant difference in mean potentials between the two groups.
State the test hypotheses.
Null hypothesis:
Alternative hypothesis:
SOLVE:
Test statistic and P-value:
Software procedure:
Step by step procedure to obtain test statistic and P-value using the MINITAB software:
- Choose Stat > Basic Statistics > 2-Sample t.
- Choose Sample in different columns.
- In First, enter the column of Diabetic Mice.
- In Second, enter the column of Normal Mice.
- Choose Options.
- In Confidence level, enter 95.
- In Alternative, select not equal.
- Click OK in all the dialogue boxes.
Output using the MINITAB software is given below:
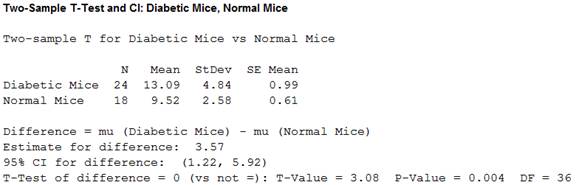
From the MINITAB output, the value of the t-statistic is 3.08 and the P-value is 0.004.
CONCLUDE:
The P-value is 0.004 and the significance level is 0.05.
Here, the P-value is less than the significance level.
That is,
Therefore, by the rejection rule, it can be concluded that there is evidence to reject
Thus, there is a significant difference in mean potentials between the two groups.
(c)
To test: Whether there is a significant difference in mean potentials between the two groups or not.
To check: Whether the outlier affects the conclusion or not.
(c)
Answer to Problem 24.58SE
The conclusion is that, there is a significant difference in mean potentials between the two groups.
No, the outlier does not affect the conclusion.
Explanation of Solution
Calculation:
PLAN:
Check whether or not there is a significant difference in mean potentials between the two groups.
State the test hypotheses.
Null hypothesis:
Alternative hypothesis:
SOLVE:
Test statistic and P-value:
Software procedure:
Step by step procedure to obtain test statistic and P-value without outlier using the MINITAB software:
- Choose Stat > Basic Statistics > 2-Sample t.
- Choose Sample in different columns.
- In First, enter the column of Diabetic Mice.
- In Second, enter the column of Normal Mice.
- Choose Options.
- In Confidence level, enter 95.
- In Alternative, select not equal.
- Click OK in all the dialogue boxes.
Output using the MINITAB software is given below:
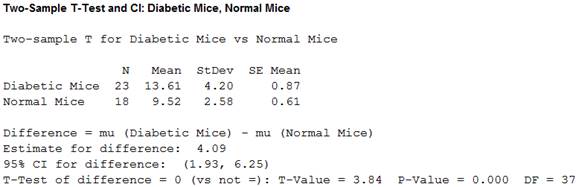
From the MINITAB output, the value of the t-statistic is 3.84 and the P-value is 0.000.
CONCLUDE:
The P-value is 0.000 and the significance level is 0.05.
Here, the P-value is less than the significance level.
That is,
Therefore, by the rejection rule, it can be concluded that there is evidence to reject
Thus, there is a significant difference in mean potentials between the two groups.
Justification:
From the results, it can be observed that the conclusions for inference with outlier and without outlier are same. Hence, the outlier does not affect the conclusion.
Want to see more full solutions like this?
Chapter 24 Solutions
Bundle: Basic Practice of Statistics 7e & LaunchPad (Twelve Month Access)


 MATLAB: An Introduction with ApplicationsStatisticsISBN:9781119256830Author:Amos GilatPublisher:John Wiley & Sons Inc
 Probability and Statistics for Engineering and th...StatisticsISBN:9781305251809Author:Jay L. DevorePublisher:Cengage Learning
 Statistics for The Behavioral Sciences (MindTap C...StatisticsISBN:9781305504912Author:Frederick J Gravetter, Larry B. WallnauPublisher:Cengage Learning
 Elementary Statistics: Picturing the World (7th E...StatisticsISBN:9780134683416Author:Ron Larson, Betsy FarberPublisher:PEARSON
 The Basic Practice of StatisticsStatisticsISBN:9781319042578Author:David S. Moore, William I. Notz, Michael A. FlignerPublisher:W. H. Freeman
 Introduction to the Practice of StatisticsStatisticsISBN:9781319013387Author:David S. Moore, George P. McCabe, Bruce A. CraigPublisher:W. H. Freeman