
Videos
To find: The value of x and s for the insulin concentrations in the two types of mice.
To test: Whether there is a significant difference in the mean insulin concentrations in the two types of mice or not.
To check: The P-value confirm the claim in the report that
Answer to Problem 24.63SE
The mean for Wild type is 59 and the mean for
The value of s for Wild type is 2.85.
The value of s for
The conclusion is that there is a significant difference in the mean insulin concentrations in the two types of mice.
Yes, the P-value confirm the claim in the report that
Explanation of Solution
Given info:
The data shows that the insulin concentrations in the two types of mice.
In the given information,
Calculation:
Mean:
From the information in Exercise 62, the mean for Wild type is 59 and the mean for
Standard deviation for Wild type:
Thus, the value of s for Wild type is 2.85.
Standard deviation for
Thus, the value of s for
PLAN:
Check whether or not there is a significant difference in the mean insulin concentrations in the two types of mice.
State the test hypotheses.
Null hypothesis:
Alternative hypothesis:
SOLVE:
Test statistic and P-value:
Software procedure:
Step by step procedure to obtain test statistic and P-value using the MINITAB software:
- Choose Stat > Basic Statistics > 2-Sample t.
- Choose Summarized data.
- In first, enter Sample size as 10, Mean as 5.9, Standard deviation as 2.85.
- In second, enter Sample size as 10, Mean as 0.75, Standard deviation as 0.632.
- Choose Options.
- In Confidence level, enter 95.
- In Alternative, select not equal.
- Click OK in all the dialogue boxes.
Output using the MINITAB software is given below:
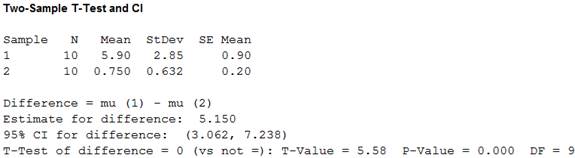
From the MINITAB output, the value of the t-statistic is 5.58 and the P-value is 0.000.
CONCLUDE:
The P-value is 0.000 and the significance level is 0.05.
Here, the P-value is less than the significance level.
That is,
Therefore, by the rejection rule, it can be concluded that there is evidence to reject
Thus, there is a significant difference in the mean insulin concentrations in the two types of mice.
Justification:
From the MINITAB output, the P-value is 0.000. Hence, the P-value confirm the claim in the report that
Want to see more full solutions like this?
Chapter 24 Solutions
Bundle: Basic Practice of Statistics 7e & LaunchPad (Twelve Month Access)


 MATLAB: An Introduction with ApplicationsStatisticsISBN:9781119256830Author:Amos GilatPublisher:John Wiley & Sons Inc
 Probability and Statistics for Engineering and th...StatisticsISBN:9781305251809Author:Jay L. DevorePublisher:Cengage Learning
 Statistics for The Behavioral Sciences (MindTap C...StatisticsISBN:9781305504912Author:Frederick J Gravetter, Larry B. WallnauPublisher:Cengage Learning
 Elementary Statistics: Picturing the World (7th E...StatisticsISBN:9780134683416Author:Ron Larson, Betsy FarberPublisher:PEARSON
 The Basic Practice of StatisticsStatisticsISBN:9781319042578Author:David S. Moore, William I. Notz, Michael A. FlignerPublisher:W. H. Freeman
 Introduction to the Practice of StatisticsStatisticsISBN:9781319013387Author:David S. Moore, George P. McCabe, Bruce A. CraigPublisher:W. H. Freeman