
Concept explainers
Videos
Internet Use The following graph shows the percentage of U.S. households using the Internet at home in 2010 as a function of household income (the data points) and a logistic model of these data (the curve).49
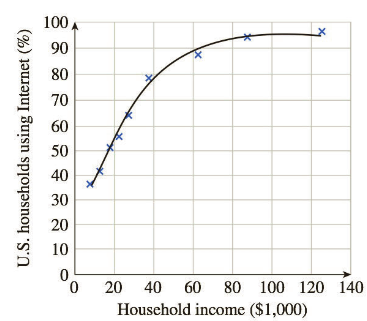
The logistic model is
a. According to the model, what percentage of extremely wealthy households used the Internet?
b. For low incomes the logistic model is approximately exponential. Which exponential model best approximates
c. According to the model, 50% of households of what income used the Internet in 2010? (Round the answer to the nearest $1,000.)

Trending nowThis is a popular solution!

Chapter 2 Solutions
Finite Mathematics and Applied Calculus (MindTap Course List)


- Modeling Human Height with a Logistic Function A male child is 21inches long at birth and grows to an adult height of 73inches. In this exercise, we make a logistic model of his height as a function of age. a. Use the given information to find K and b for the logistic model. b. Suppose he reaches 95 of his adult height at age 16. Use this information and that from part a to find r. Suggestion: You will need to use either the crossing-graphs method or some algebra involving the logarithm. c. Make a logistic model for his height H, in inches, as a function of his age t, in years. d. According to the logistic model, at what age is he growing the fastest? e. Is your answer to part d consistent with your knowledge of how humans grow?arrow_forwardEastern Pacific Yellowfin Tuna Studies to fit a logistic model to the Eastern Pacific yellowfin tuna population have yielded N=1481+36e2.61t where t is measured in years and N is measured in thousands of tons of fish. a. What is the r value for the Eastern Pacific yellowfin tuna? b. What is the carrying capacity K for the Eastern Pacific yellowfin tuna? c. What is the optimum yield level? d. Use your calculator to graph N versus t. e. At what time was the population growing the most rapidly?arrow_forwardLogistic Population growth the table and scatter plot give the population of black flies in a closed laboratory container over an 18 day period. (a) Use the logistic command on your calculator to find a logistic model for these data. (b) Use the model to estimate the time when there were 400 flies in the containerarrow_forward
- The population of a lake of fish is modeled by the logistic equation P(t)=16,1201+25e0.75t, where t is time inyears. To the unrest hundredth, how manyyears will it take the lake to reach 80% of its carrying capacity?For the following exercises, use a graphing utility to create a scatter diagram of the data given in the table.Observe the shape of the scatter diagram to determine whether the data is best described by an exponential,logarithmic, or logistic model. Then use the appropriate regression feature to find an equation that models thedata. When necessary, round values to five decimal places.arrow_forwardCable TV The following table shows the number C. in millions, of basic subscribers to cable TV in the indicated year These data are from the Statistical Abstract of the United States. Year 1975 1980 1985 1990 1995 2000 C 9.8 17.5 35.4 50.5 60.6 60.6 a. Use regression to find a logistic model for these data. b. By what annual percentage would you expect the number of cable subscribers to grow in the absence of limiting factors? c. The estimated number of subscribers in 2005 was 65.3million. What light does this shed on the model you found in part a?arrow_forwardA Population of Foxes A breeding group of foxes is introduced into a protected are and exhibits logistic population growth. After t years, the number of foxes is given by N(t)=37.50.25+0.76t foxes. a. How many foxes were introduced into the protected area? b. Calculate N(5) and explain the meaning of the number you have calculated. c. Explain how the population varies with time. Include in your explanation the average rate of increase over the first 10-year period and the average rate of increase over the second 10-year period. d. Find the carrying capacity for foxes in the protected area. e. As we saw in the discussion of terminal velocity for a skydiver, the question of when the carrying capacity is reached may lead to an involved discussion. We ask the question differently. When is 99 of carrying capacity reached?arrow_forward
- World Population The following table shows world population N, in billions, in the given year. Year 1950 1960 1970 1980 1990 2000 2010 N 2.56 3.04 3.71 4.45 5.29 6.09 6.85 a. Use regression to find a logistic model for world population. b. What r value do these data yield for humans on planet Earth? c. According to the logistic model using these data, what is the carrying capacity of planet Earth for humans? d. According to this model, when will world population reach 90 of carrying capacity? Round to the nearest year. Note: This represents a rather naive analysis of world population.arrow_forwardWhat is the y -intercept of the logistic growth model y=c1+aerx ? Show the steps for calculation. What does this point tell us about the population?arrow_forwardTable 6 shows the population, in thousands, of harbor seals in the Wadden Sea over the years 1997 to 2012. a. Let x represent time in years starting with x=0 for the year 1997. Let y represent the number of seals in thousands. Use logistic regression to fit a model to these data. b. Use the model to predict the seal population for the year 2020. c. To the nearest whole number, what is the limiting value of this model?arrow_forward
 Functions and Change: A Modeling Approach to Coll...AlgebraISBN:9781337111348Author:Bruce Crauder, Benny Evans, Alan NoellPublisher:Cengage Learning
 Algebra & Trigonometry with Analytic GeometryAlgebraISBN:9781133382119Author:SwokowskiPublisher:Cengage
 College AlgebraAlgebraISBN:9781305115545Author:James Stewart, Lothar Redlin, Saleem WatsonPublisher:Cengage Learning
 Algebra and Trigonometry (MindTap Course List)AlgebraISBN:9781305071742Author:James Stewart, Lothar Redlin, Saleem WatsonPublisher:Cengage Learning
 College Algebra (MindTap Course List)AlgebraISBN:9781305652231Author:R. David Gustafson, Jeff HughesPublisher:Cengage Learning