
Concept explainers
Videos
Housing Price Index. Realtors use an index to compare housing prices in major cities. The index numbers for several cities are given in the table below. In Exercises 25–32, use the following to find the price of a home in the given town.
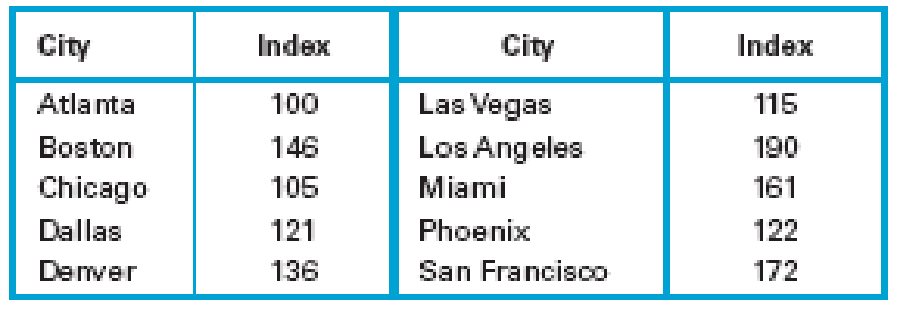
28. Phoenix and Boston. If a house is valued at $650,000 in Boston, find the price of a comparable house in Phoenix.
Want to see the full answer?
Check out a sample textbook solution
Chapter 2 Solutions
Statistical Reasoning for Everyday Life Plus MyLab Statistics with Pearson eText -- 18 Week Access Card Package (5th Edition)


- The data in the table represent the number of licensed drivers in various age groups and the number of fatal accidents within the age group by gender. Complete parts (a) to (c) below. Click the icon to view the data table. Data for licensed drivers by age and gender. Number of Number of Number of Male Fatal Number of Female Fatal Licensed Drivers Crashes Licensed Drivers Crashes Age (000s) (Males) (000s) (Females) 74 4,803 2,022 5,375 975 Print Donearrow_forwardIn 2011, home prices and mortgage rates fell so far that in a number of cities the monthly cost of owning a home was less expensive than renting. The following data show the average asking rent and the monthly mortgage on the median-priced home (including taxes and insurance) for 10 cities where the average monthly mortgage payment was less than the average asking rent (The Wall Street Journal, November 26–27, 2011). 7. City Rent ($) Mortgage ($) Atlanta 840 539 1062 1002 Chicago Detroit 823 626 DATA file Jacksonville, Fla. Las Vegas 779 711 796 655 RentMortgage 1071 953 Miami 977 Minneapolis Orlando, Fla. 776 851 695 762 651 654 Phoenix St. Louis 723 Develop a scatter diagram for these data, treating the average asking rent as the inde- pendent variable. Does a simple linear regression model appear to be appropriate? b. Use a simple linear regression model to develop an estimated regression equation to predict the monthly mortgage on the median-priced home given the average asking…arrow_forwardThe table to the right gives the cost of living index (COLI) for six East Coast counties and six Midwest counties (using an index where 100 represents the average cost of living for all participating cities with a population of more than 1.5 million). Answer parts (a) through (e) below. East Coast Counties Midwest Counties A 104.1 U 96.4 B 128.3 V 92.7 C 314.5 W 94.2 D 134.9 X 87.5 E 123.8 Y 95.8 F 141.1 Z 228.3 The table to the right gives the cost of living index (COLI) for six East Coast counties and six Midwest counties (using an index where 100 represents the average cost of living for all participating cities with a population of more than 1.5 million). Answer parts (a) through (e) below. East Coast Counties Midwest Counties A 104.1 U 96.4 B 128.3 V 92.7 C 314.5 W 94.2 D 134.9 X 87.5 E 123.8 Y 95.8 F 141.1 Z…arrow_forward
- The boxplots below show the real estate values of single-family homes in two neighboring cities (in thousands of dollars). Statstown Medianville 0 20 40 60 80 100 120 140 Annual Income Which city has more households? A. Statstown B. O Medianville C. O Both cities have the same number of households. D. It is impossible to tell from the boxplots.arrow_forwardThe table to the right gives the cost of living index (COLI) for six East Coast counties and six Midwest counties (using an index where 100 represents the average cost of living for all participating cities with a population of more than 1.5 million). Answer parts (a) through (e) below. East Coast Counties Midwest Counties A 104.5 U 96.3 B 128.4 V 92.5 C 314.2 W 94.3 D 134.2 X 87.5 E 123.2 Y 95.5 F 141.2 Z 228.4 a. Find the mean, median, and range for each of the two data sets. The mean for the East Coast Counties is . (Type an integer or decimal rounded to two decimal places asneeded.)arrow_forward3.4 #9 Please answer a and barrow_forward
- Which model appears to be the best accordingly? A. Model I B. Model II C. Model III D. Model IVarrow_forwardC. Describe the four characteristics of associationarrow_forwardThe boxplot below shows salaries for Construction workers and Teachers. Construction Teacher E 20 25 30 35 40 Salary (thousands of $) They are making more than Question Help: Video If a person is making the minimum salary for a construction worker, they are making more than what percentage of Teachers? Submit Question 45 50 Search + 55 % of Teachers. Enter an integer or decimal number [more..]arrow_forward
- In Exercises 29–32, identify the level of measurement of the data as nominal, ordinal, interval, or ratio. Also, explain what is wrong with the given calculation. Temperatures As this exercise is being written, it is 80°F at the author’s home and it is 40°F in Auckland, New Zealand, so it is twice as warm at the author’s home as it is in Auckland, New Zealand.arrow_forwardPlease help. I will give a good rating. Thank you!arrow_forwardDuring one shift, the express lane clerk recorded how many times customers violated the "10 items or less" rule for his lane. In particular, he recorded how many items over the limit each violator placed on the conveyor belt. This data is summarized in the histogram below. NOTE: The last class actually represents "7 or more items," not just 7 items. 14+ 12 10- 8- 6- 4 0.5 1.5 2.5 3.5 4.5 5.5 6.5 7.5 # items over 10 What is the most frequent number of over-the-limit items for this data set? ans = What is the frequency of the most frequent number of over-the-limit items? ans = Frequency 2.arrow_forward
 MATLAB: An Introduction with ApplicationsStatisticsISBN:9781119256830Author:Amos GilatPublisher:John Wiley & Sons Inc
 Probability and Statistics for Engineering and th...StatisticsISBN:9781305251809Author:Jay L. DevorePublisher:Cengage Learning
 Statistics for The Behavioral Sciences (MindTap C...StatisticsISBN:9781305504912Author:Frederick J Gravetter, Larry B. WallnauPublisher:Cengage Learning
 Elementary Statistics: Picturing the World (7th E...StatisticsISBN:9780134683416Author:Ron Larson, Betsy FarberPublisher:PEARSON
 The Basic Practice of StatisticsStatisticsISBN:9781319042578Author:David S. Moore, William I. Notz, Michael A. FlignerPublisher:W. H. Freeman
 Introduction to the Practice of StatisticsStatisticsISBN:9781319013387Author:David S. Moore, George P. McCabe, Bruce A. CraigPublisher:W. H. Freeman