
Concept explainers
Videos
Exercises 35 and 36 are based on the discussion following Example 2. If the limiting value N is known, then
Population: Virgin Islands The following table and graph show the population of the Virgin Islands in thousands from 1950 to 2025:57
| t (years since 1950) | 0 | 10 | 20 | 30 | 40 | 50 |
| Population (thousands) | 27 | 33 | 63 | 98 | 104 | 106 |
| t (years since 1950) | 55 | 60 | 65 | 70 | 75 |
| Population (thousands) | 108 | 108 | 107 | 107 | 108 |
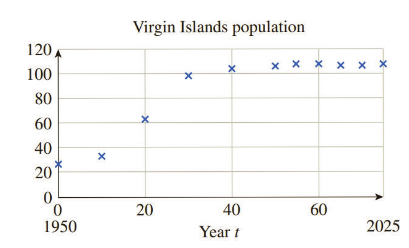
Take t to be the number of years since 1950, and find a logistic model based on the assumption that, eventually, the population of the Virgin Islands will grow to 110,000. (Round coefficients to four decimal places.) In what year does your model predict that the population of the Virgin Islands first reached 80,000?
Want to see the full answer?
Check out a sample textbook solution
Chapter 2 Solutions
WebAssign Printed Access Card for Waner/Costenoble's Applied Calculus, 7th Edition, Single-Term


- Does a linear, exponential, or logarithmic model best fit the data in Table 2? Find the model.arrow_forwardIs carbon dating? Why does it work? Give an example in which carbon dating would be useful.arrow_forwardWhat type (s) of translation(s), if any, affect the range of a logarithmic function?arrow_forward
- Use log21=0,log22=1, and log24=2 to estimate log23.arrow_forwardSales of a video game released in the year 2000 took off at first, but then steadily slowed as time moved on. Table 4 shows the number of games sold, in thousands, from the years 20002010. a. Let x represent time in years starting with x=1 for the year 2000. Let y represent the number of games sold in thousands. Use logarithmic regression to fit a model to these data. b. If games continue to sell at this rate, how many games will sell in 2015? Round to the nearest thousand.arrow_forwardThe population of a culture of bacteria is modeled by the logistic equation P(t)=14,2501+29e0.62t where t is inarrow_forward
- The following data represent the population of a country An ecologist is interested in building a model that describes the population (a) Treating the year as the independent variable and the population as the dependent variable, use a graphing utility to fit a logistic model from the data. Population, y 76,212.200 92,228,500 106,021,500 123,202,600 132,164,600 151,325,800 179,323,200 203,302,000 226,542.200 248,709,900 281,421,900 Year, x Find the values for a, b and c in a logistic model of the form y = 1900 1910 -bx 1+ae 1920 1930 1940 1950 1960 1970 1980 1990 2000 (Use scientific notation. Round to five decimal places as needed) b- (Round to four decimal places as needed) (Round to one decimal place as needed.) (b) Graph the data together with the logistic function found in part (a) on a scatter diagram Which graph correctly illustrates the logistic growth model for this data? OA. 0.000.000 Q 2010 76000 000 O B. 20. 2010 16.000.000 OC. 2010 71.000 000 () Time Remaining: 00404 ofarrow_forwardRecall that the logistic model can be written in the form a) Give the formulas for finding the growth rater and the carrying capacity N. r = Select an answer N=Select an answer Pn=b-Pn-1-a p²-1 b) Consider the logistic model given by the DDS below: Find the following. The growth rate r = The carrying capacity N Pn = 0.55 pm-1 +0.000643 p-1 Round to 2 decimal places as needed. Round to the nearest whole number as needed.arrow_forwardAs part of a research project, you need to perform some population studies and find the followingdata: year 1980 1985 1990 1995 pop. (millions) 227.01 236.99 248.89 261.91From experience, you know that population models are more typically represented by exponential models (i.e.,P (t) = aebt) rather than linear models. However, since least squares is a linear approximation, we’ll improvise.Taking the log of both sides gives the linear equation,ln P (t) = ln(a) + bt a) Using the data given above, find the least squares solution for the best fit exponential curve (i.e., find thebest approximation to ’a’ and ’b’). (b) Use your equation to approximate the population in 2010.arrow_forward
- Find a logistic function that describes the given population. Then graph the population function. The population increases from 300 to 700 in the first year and eventually levels off at 3000. Write the equation of a logistic function that models the given population. P(t) = (Type an exact answer.)arrow_forward7.8.7 d) in the early 1970s there were approximately 40,000 trees lining the streets of Newton. Today, that number is about 26,000-a 35% loss. The current annual rate of decline is about 650 trees per year. At this rate, if unchecked, public street trees would diminish to approximately 10,000 within a generation (25 years), and in 40 years, public street trees would no longer be part of the Newton landscape. a-c will be answered in the picture attached a) check the arithmetic that leads to the claimed "35% loss" b) check the arithmetic that leads to a "current annual rate of 650 trees per year". c) check the predictions in the last sentence. are they likely to come to pass? now, using the information in the paragraph and the questions + work shown, answer d) d) write the equation for the linear model implicit in this quotation (use years since 2012 as the independent variable). identify the slope and the intercept, with their units.arrow_forwardLife expectancy is the key metric for assessing population health. The following graph shows the life expectancy for the United States and Africa between the years 1970 and 2020. Let U(t) represent the life expectancy (in years) in the United States and A(t) represent the life expectancy (in years) in Africa, where t is the number of years since 1970. Life Expectancy in Years 739 N NI N na 9 S United States 70 Atrica SL4 SA 47.7 40 190 1995 190 195 1990 1995 2000 200s 2010 201s 2020 Year Evaluate (U - A) (20) and give a practical interpretation. O (U - A) (20) = -14.0 In 2020, the life expectancy in the United States was 14.0 years less than the life expectance in Africa. O (U - A) (20) = 23.1 In 1990, the life expectancy in the United States was 23.1 years more than the life expectancy in Africa. None of these O (U – A) (20) = -23.1 In 1990, the life expectancy in the United States was 23.1 years less than the life expectancy in Africa. O (U - A) (20) = 14.0 In 2020, the life…arrow_forward
 College Algebra (MindTap Course List)AlgebraISBN:9781305652231Author:R. David Gustafson, Jeff HughesPublisher:Cengage Learning
 Algebra & Trigonometry with Analytic GeometryAlgebraISBN:9781133382119Author:SwokowskiPublisher:Cengage
 Algebra: Structure And Method, Book 1AlgebraISBN:9780395977224Author:Richard G. Brown, Mary P. Dolciani, Robert H. Sorgenfrey, William L. ColePublisher:McDougal Littell
 Glencoe Algebra 1, Student Edition, 9780079039897...AlgebraISBN:9780079039897Author:CarterPublisher:McGraw Hill
 Elementary Linear Algebra (MindTap Course List)AlgebraISBN:9781305658004Author:Ron LarsonPublisher:Cengage Learning