
WebAssign Printed Access Card for Waner/Costenoble's Applied Calculus, 7th Edition, Single-Term
7th Edition
ISBN: 9781337652742
Author: Stefan Waner, Steven Costenoble
Publisher: Cengage Learning
expand_more
expand_more
format_list_bulleted
Concept explainers
Videos
Question
Chapter 2.4, Problem 21E
(a)
To determine
The correct logistic function from the given choices for the following curve, the graph shows the approximate percentage of mortgages issued in the United States during the real-state run-up in
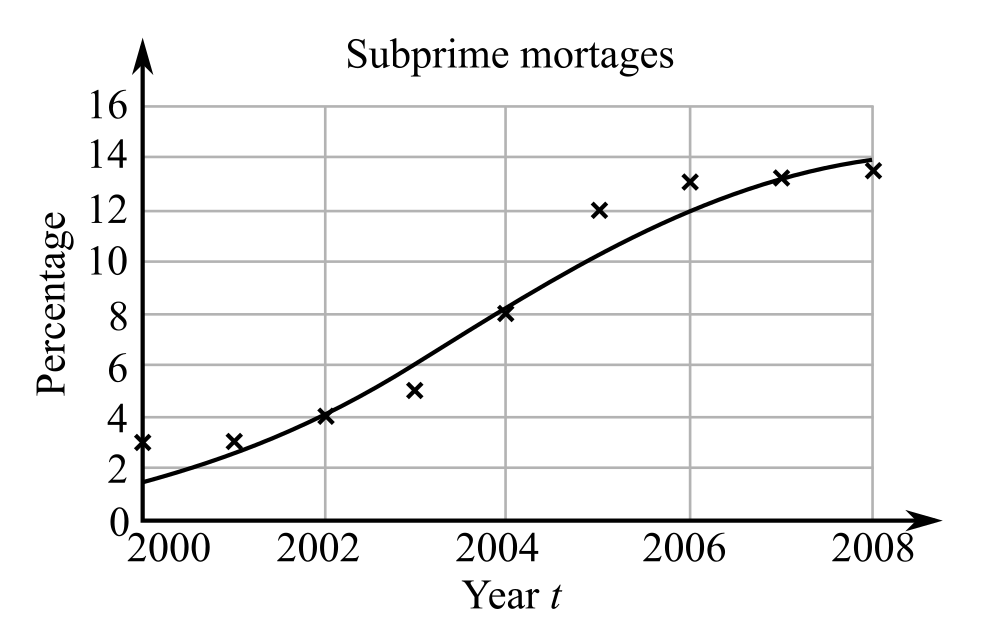
The options are:
(A).
(B).
(C).
(D).
(b)
To determine
To calculate: The year for which the percentage is growing fastest according to the obtained model for the graph as shown below:
Expert Solution & Answer
Want to see the full answer?
Check out a sample textbook solution
Students have asked these similar questions
The file P02_26.xlsx lists sales (in millions of dollars) of Dell Computer during the period 1987–1997 (where year 1 corresponds to 1987).
Year
Sales
1
69
2
159
3
258
4
389
5
546
6
890
7
2014
8
2873
9
3475
10
5296
11
7759
a. Fit a power and an exponential trend curve to these data. Which fits the data better?
b. Use your part a answer to predict 1999 sales for Dell.
c. Use your part a answer to describe how the sales of Dell have grown from year to year.
Please help me understand how to calcualate the Odds Ratio of the slope.
A researcher is attempting to explore the relationship between study duration per day (0 - 8) and the passing of the science course (Pass=1, Fail=0). For this purpose, a sample of 36 students from Alabama University are chosen. Summary of the logistic regression model is given below in photo.
Q1. The table provided gives data on indexes of output per hour (X) and real compensation per hour (Y) for the business and nonfarm business sectors of the U.S. economy for 1960–2005. The base year of the indexes is 1992 = 100 and the indexes are seasonally adjusted.
a. Plot Y against X for the two sectors separately.
b. What is the economic theory behind the relationship between the two variables? Does the scattergram support the theory?
c. Estimate the OLS regression of Y on X.
Note: on the table ( 1. Output refers to real gross domestic product in the sector. 2. Wages and salaries of employees plus employers’ contributions for social insurance and private benefit plans. 3. Hourly compensation divided by the consumer price index for all urban consumers for recent quarters.)
Thank you!
Chapter 2 Solutions
WebAssign Printed Access Card for Waner/Costenoble's Applied Calculus, 7th Edition, Single-Term
Ch. 2.1 - In Exercises 16, (a) state the values of a, b, and...Ch. 2.1 - In Exercises 16, (a) state the values of a, b, and...Ch. 2.1 - Prob. 3ECh. 2.1 - Prob. 4ECh. 2.1 - Prob. 5ECh. 2.1 - Prob. 6ECh. 2.1 - Prob. 7ECh. 2.1 - Prob. 8ECh. 2.1 - In Exercises 716, sketch the graph of the...Ch. 2.1 - Prob. 10E
Ch. 2.1 - Prob. 11ECh. 2.1 - Prob. 12ECh. 2.1 - Prob. 13ECh. 2.1 - Prob. 14ECh. 2.1 - Prob. 15ECh. 2.1 - Prob. 16ECh. 2.1 - In Exercises 1720, for each demand equation,...Ch. 2.1 - Prob. 18ECh. 2.1 - In Exercises 1720, for each demand equation,...Ch. 2.1 - In Exercises 1720, for each demand equation,...Ch. 2.1 - In Exercises 2124, use technology to find the...Ch. 2.1 - Prob. 22ECh. 2.1 - Prob. 23ECh. 2.1 - Prob. 24ECh. 2.1 - World Military Expenditure The following chart...Ch. 2.1 - Education Expenditure The following chart shows...Ch. 2.1 - Oil Imports from Mexico Crude oil imports to the...Ch. 2.1 - Oil Production in Mexico Crude oil production by...Ch. 2.1 - GE Net Income 20092013 The annual net income of...Ch. 2.1 - GE Net Income 20072011 The annual net income of...Ch. 2.1 - Revenue The market research department of the...Ch. 2.1 - Revenue The Better Baby Buggy Co. has just come...Ch. 2.1 - Revenue Pack-Em-In Real Estate is building a new...Ch. 2.1 - Revenue Pack-Em-In has another development in the...Ch. 2.1 - Revenue from Monorail Service, Las Vegas In 2005...Ch. 2.1 - Revenue from Monorail Service, Mars The Utarek...Ch. 2.1 - Website Profit You operate a gaming website,...Ch. 2.1 - T-Shirt Profit Two fraternities, Sig Ep and Ep...Ch. 2.1 - Website Profit The latest demand equation for your...Ch. 2.1 - T-Shirt Profit The latest demand equation for your...Ch. 2.1 - Nightclub Management You have just opened a new...Ch. 2.1 - Television Advertising As sales manager for...Ch. 2.1 - World Military Expenditure The following table...Ch. 2.1 - Prob. 44ECh. 2.1 - iPod Sales The following table shows Apple iPod...Ch. 2.1 - Prob. 46ECh. 2.1 - What can you say about the graph of f(x)=ax2+bx+c...Ch. 2.1 - What can you say about the graph of f(x)=ax2+bx+c...Ch. 2.1 - Multiple choice: Following is the graph of...Ch. 2.1 - Multiple choice: Following is the graph of...Ch. 2.1 - Refer to the graph of f(x)=ax2+bx+c in Exercise...Ch. 2.1 - Prob. 52ECh. 2.1 - Prob. 53ECh. 2.1 - Prob. 54ECh. 2.1 - Prob. 55ECh. 2.1 - Prob. 56ECh. 2.1 - Prob. 57ECh. 2.1 - Prob. 58ECh. 2.1 - Prob. 59ECh. 2.1 - Prob. 60ECh. 2.1 - If the revenue function for a particular commodity...Ch. 2.1 - If the revenue function for a particular commodity...Ch. 2.2 - In Exercises 1-12, compute the missing values in...Ch. 2.2 - Prob. 2ECh. 2.2 - In Exercises 1-12, compute the missing values in...Ch. 2.2 - In Exercises 1-12, compute the missing values in...Ch. 2.2 - In Exercises 1-12, compute the missing values in...Ch. 2.2 - In Exercises 1-12, compute the missing values in...Ch. 2.2 - Prob. 7ECh. 2.2 - Prob. 8ECh. 2.2 - Prob. 9ECh. 2.2 - Prob. 10ECh. 2.2 - Prob. 11ECh. 2.2 - Prob. 12ECh. 2.2 - In Exercises 13-18, graph the given function using...Ch. 2.2 - Prob. 14ECh. 2.2 - Prob. 15ECh. 2.2 - In Exercises 13-18, graph the given function using...Ch. 2.2 - Prob. 17ECh. 2.2 - In Exercises 13-18, graph the given function using...Ch. 2.2 - In Exercises 19-24 the values of two functions, f...Ch. 2.2 - In Exercises 19-24 the values of two functions, f...Ch. 2.2 - Prob. 21ECh. 2.2 - Prob. 22ECh. 2.2 - Prob. 23ECh. 2.2 - Prob. 24ECh. 2.2 - In Exercises 25-30, supply a valid technology...Ch. 2.2 - Prob. 26ECh. 2.2 - In Exercises 25-30, supply a valid technology...Ch. 2.2 - In Exercises 25-30, supply a valid technology...Ch. 2.2 - In Exercises 25-30, supply a valid technology...Ch. 2.2 - Prob. 30ECh. 2.2 - Prob. 31ECh. 2.2 - Prob. 32ECh. 2.2 - Prob. 33ECh. 2.2 - Prob. 34ECh. 2.2 - In Exercises 3138, supply a valid technology...Ch. 2.2 - Prob. 36ECh. 2.2 - Prob. 37ECh. 2.2 - Prob. 38ECh. 2.2 - Prob. 39ECh. 2.2 - Prob. 40ECh. 2.2 - Prob. 41ECh. 2.2 - Prob. 42ECh. 2.2 - Prob. 43ECh. 2.2 - Prob. 44ECh. 2.2 - Prob. 45ECh. 2.2 - Prob. 46ECh. 2.2 - In Exercises 47-54, model the data using an...Ch. 2.2 - Prob. 48ECh. 2.2 - Prob. 49ECh. 2.2 - Prob. 50ECh. 2.2 - In Exercises 47-54, model the data using an...Ch. 2.2 - Prob. 52ECh. 2.2 - In Exercises 47-54, model the data using an...Ch. 2.2 - Prob. 54ECh. 2.2 - Prob. 55ECh. 2.2 - Prob. 56ECh. 2.2 - In Exercises 55-62, find an equation for an...Ch. 2.2 - Prob. 58ECh. 2.2 - In Exercises 55-62, find an equation for an...Ch. 2.2 - Prob. 60ECh. 2.2 - Prob. 61ECh. 2.2 - Prob. 62ECh. 2.2 - In Exercises 63-66, obtain an exponential function...Ch. 2.2 - In Exercises 63-66, obtain an exponential function...Ch. 2.2 - In Exercises 63-66, obtain an exponential function...Ch. 2.2 - Prob. 66ECh. 2.2 - Prob. 67ECh. 2.2 - Prob. 68ECh. 2.2 - Prob. 69ECh. 2.2 - Prob. 70ECh. 2.2 - Aspirin Soon after taking an aspirin, a patient...Ch. 2.2 - Alcohol After a large number of drinks, a person...Ch. 2.2 - Freon Production The production of...Ch. 2.2 - Revenue The annual revenue of Amazon rose from...Ch. 2.2 - U.S. Population The U.S. population was 180...Ch. 2.2 - World Population World population was estimated at...Ch. 2.2 - Frogs Frogs have been breeding like flies at the...Ch. 2.2 - Flies Flies in Suffolk County have been breeding...Ch. 2.2 - Bacteria A bacteria culture starts with 1,000...Ch. 2.2 - Bacteria A bacteria culture starts with 1,000...Ch. 2.2 - Prob. 81ECh. 2.2 - The 2003 SARS Outbreak A few weeks into the deadly...Ch. 2.2 - Prob. 83ECh. 2.2 - Prob. 84ECh. 2.2 - Investments In August 2013, E*TRADE Financial was...Ch. 2.2 - Prob. 86ECh. 2.2 - Prob. 87ECh. 2.2 - Prob. 88ECh. 2.2 - Investments Rock Solid Bank Trust is offering a...Ch. 2.2 - Savings FlybynightSavings.com is offering a...Ch. 2.2 - Home Sales Sales of existing homes in the United...Ch. 2.2 - Home Prices The median selling price of an...Ch. 2.2 - Climate Change The most abundant greenhouse gas is...Ch. 2.2 - Prob. 94ECh. 2.2 - New York City Housing Costs: Downtown The...Ch. 2.2 - Prob. 96ECh. 2.2 - Prob. 97ECh. 2.2 - Prob. 98ECh. 2.2 - Prob. 99ECh. 2.2 - Which of the following three functions will be...Ch. 2.2 - Prob. 101ECh. 2.2 - Prob. 102ECh. 2.2 - Prob. 103ECh. 2.2 - Prob. 104ECh. 2.2 - Describe two real-life situations in which a...Ch. 2.2 - Describe a real-life situation in which a...Ch. 2.2 - Prob. 107ECh. 2.2 - Prob. 108ECh. 2.2 - Prob. 109ECh. 2.2 - Prob. 110ECh. 2.3 - If y=4x, then x=.Ch. 2.3 - If y=log6x, then x=.Ch. 2.3 - Simplify: 2log28.Ch. 2.3 - Simplify: elnx.Ch. 2.3 - Simplify: ln(ex).Ch. 2.3 - Simplify: lna.Ch. 2.3 - In Exercises 7-14, graph the given function....Ch. 2.3 - In Exercises 7-14, graph the given function....Ch. 2.3 - In Exercises 7-14, graph the given function....Ch. 2.3 - Prob. 10ECh. 2.3 - Prob. 11ECh. 2.3 - Prob. 12ECh. 2.3 - Prob. 13ECh. 2.3 - Prob. 14ECh. 2.3 - In Exercises 15-20, find the associated...Ch. 2.3 - In Exercises 15-20, find the associated...Ch. 2.3 - Prob. 17ECh. 2.3 - Prob. 18ECh. 2.3 - In Exercises 15-20, find the associated...Ch. 2.3 - In Exercises 15-20, find the associated...Ch. 2.3 - In Exercises 21-26, find the associated half-life...Ch. 2.3 - Prob. 22ECh. 2.3 - Prob. 23ECh. 2.3 - Prob. 24ECh. 2.3 - In Exercises 21-26, find the associated half-life...Ch. 2.3 - In Exercises 21-26, find the associated half-life...Ch. 2.3 - In Exercises 27-32, convert the given exponential...Ch. 2.3 - In Exercises 27-32, convert the given exponential...Ch. 2.3 - In Exercises 27-32, convert the given exponential...Ch. 2.3 - In Exercises 27-32, convert the given exponential...Ch. 2.3 - In Exercises 27-32, convert the given exponential...Ch. 2.3 - In Exercises 27-32, convert the given exponential...Ch. 2.3 - Investments How long will it take a $500...Ch. 2.3 - Investments How long will it take a $500...Ch. 2.3 - Investments How long, to the nearest year, will it...Ch. 2.3 - Investments How long, to the nearest year, will it...Ch. 2.3 - Prob. 37ECh. 2.3 - Depreciation My investment in OHaganBooks.com...Ch. 2.3 - Carbon Dating The amount of carbon 14 remaining in...Ch. 2.3 - Carbon Dating Refer to Exercise 39. How old, to...Ch. 2.3 - Long-Term Investments Exercises 41-48 are based on...Ch. 2.3 - Long-Term Investments Exercises 41-48 are based on...Ch. 2.3 - Long-Term Investments Exercises 41-48 are based on...Ch. 2.3 - Long-Term Investments Exercises 41-48 are based on...Ch. 2.3 - Long-Term Investments Exercises 41-48 are based on...Ch. 2.3 - Prob. 46ECh. 2.3 - Long-Term Investments Exercises 41-48 are based on...Ch. 2.3 - Prob. 48ECh. 2.3 - Half-Life The amount of radium 226 remaining in a...Ch. 2.3 - Half-Life The amount of iodine 131 remaining in a...Ch. 2.3 - Automobiles The rate of auto thefts triples every...Ch. 2.3 - Prob. 52ECh. 2.3 - Half-Life The half-life of cobalt 60 is 5 years....Ch. 2.3 - Half-Life The half-life of strontium 90 is 28...Ch. 2.3 - Radioactive Decay Uranium 235 is used as fuel for...Ch. 2.3 - Radioactive Decay Plutonium 239 is used as fuel...Ch. 2.3 - Prob. 57ECh. 2.3 - Alcohol After a large number of drinks, a person...Ch. 2.3 - Radioactive Decay You are trying to determine the...Ch. 2.3 - Prob. 60ECh. 2.3 - Population Aging The following table shows the...Ch. 2.3 - Prob. 62ECh. 2.3 - Prob. 63ECh. 2.3 - Prob. 64ECh. 2.3 - Richter Scale The Richter scale is used to measure...Ch. 2.3 - Sound Intensity The loudness of a sound is...Ch. 2.3 - Prob. 67ECh. 2.3 - Prob. 68ECh. 2.3 - Prob. 69ECh. 2.3 - Prob. 70ECh. 2.3 - Prob. 71ECh. 2.3 - Prob. 72ECh. 2.3 - Prob. 73ECh. 2.3 - Prob. 74ECh. 2.3 - Prob. 75ECh. 2.3 - Prob. 76ECh. 2.3 - Prob. 77ECh. 2.4 - Prob. 1ECh. 2.4 - Prob. 2ECh. 2.4 - Prob. 3ECh. 2.4 - Prob. 4ECh. 2.4 - Prob. 5ECh. 2.4 - Prob. 6ECh. 2.4 - Prob. 7ECh. 2.4 - In Exercises 7-10, find the logistic function f...Ch. 2.4 - Prob. 9ECh. 2.4 - Prob. 10ECh. 2.4 - Prob. 11ECh. 2.4 - Prob. 12ECh. 2.4 - Prob. 13ECh. 2.4 - In Exercises 11-16, choose the logistic function...Ch. 2.4 - Prob. 15ECh. 2.4 - Prob. 16ECh. 2.4 - Prob. 17ECh. 2.4 - Prob. 18ECh. 2.4 - Prob. 19ECh. 2.4 - Prob. 20ECh. 2.4 - Prob. 21ECh. 2.4 - Prob. 22ECh. 2.4 - Prob. 23ECh. 2.4 - Prob. 24ECh. 2.4 - Prob. 25ECh. 2.4 - Internet Use The following graph shows the...Ch. 2.4 - Epidemics There are currently 1,000 cases of...Ch. 2.4 - Prob. 28ECh. 2.4 - Sales You have sold 100 I Calculus T-shirts, and...Ch. 2.4 - Sales In Russia the average consumer drank two...Ch. 2.4 - Prob. 31ECh. 2.4 - College Basketball: Men The following table shows...Ch. 2.4 - College Basketball: Women The following table...Ch. 2.4 - Prob. 35ECh. 2.4 - Exercises 35 and 36 are based on the discussion...Ch. 2.4 - Prob. 37ECh. 2.4 - Prob. 38ECh. 2.4 - Give one practical use for logistic regression.Ch. 2.4 - Prob. 40ECh. 2.4 - Prob. 41ECh. 2.4 - Prob. 42ECh. 2.4 - Prob. 43ECh. 2.4 - Prob. 44ECh. 2 - Sketch the graph of the quadratic functions in...Ch. 2 - Prob. 2RECh. 2 - Prob. 3RECh. 2 - Prob. 4RECh. 2 - Prob. 5RECh. 2 - Prob. 6RECh. 2 - Prob. 7RECh. 2 - Prob. 8RECh. 2 - Prob. 9RECh. 2 - Prob. 10RECh. 2 - Prob. 11RECh. 2 - Prob. 12RECh. 2 - Prob. 13RECh. 2 - Prob. 14RECh. 2 - In Exercises 15-18, find a formula of the form...Ch. 2 - Prob. 16RECh. 2 - In Exercises 15-18, find a formula of the form...Ch. 2 - Prob. 18RECh. 2 - Prob. 19RECh. 2 - Prob. 20RECh. 2 - Prob. 21RECh. 2 - Prob. 22RECh. 2 - Prob. 23RECh. 2 - Prob. 24RECh. 2 - Prob. 25RECh. 2 - Prob. 26RECh. 2 - Prob. 27RECh. 2 - Prob. 28RECh. 2 - Prob. 29RECh. 2 - Prob. 30RECh. 2 - Prob. 31RECh. 2 - Prob. 32RECh. 2 - Prob. 33RECh. 2 - Prob. 35RECh. 2 - Revenue and Profit Billy-Sean OHagan is John...Ch. 2 - Prob. 37RECh. 2 - Prob. 38RECh. 2 - Prob. 39RECh. 2 - Prob. 40RECh. 2 - Lobsters We saw in Exercise 37 that the Long...Ch. 2 - Prob. 42RECh. 2 - Prob. 43RECh. 2 - Prob. 44RECh. 2 - Prob. 45RECh. 2 - Prob. 50RE
Knowledge Booster


Learn more about
Need a deep-dive on the concept behind this application? Look no further. Learn more about this topic, calculus and related others by exploring similar questions and additional content below.Similar questions
- Cable TV The following table shows the number C. in millions, of basic subscribers to cable TV in the indicated year These data are from the Statistical Abstract of the United States. Year 1975 1980 1985 1990 1995 2000 C 9.8 17.5 35.4 50.5 60.6 60.6 a. Use regression to find a logistic model for these data. b. By what annual percentage would you expect the number of cable subscribers to grow in the absence of limiting factors? c. The estimated number of subscribers in 2005 was 65.3million. What light does this shed on the model you found in part a?arrow_forwardWhat does the y -intercept on the graph of a logistic equation correspond to for a population modeled by that equation?arrow_forwardTable 2 shows a recent graduate’s credit card balance each month after graduation. a. Use exponential regression to fit a model to these data. b. If spending continues at this rate, what will the graduate’s credit card debt be one year after graduating?arrow_forward
- Sales of a video game released in the year 2000 took off at first, but then steadily slowed as time moved on. Table 4 shows the number of games sold, in thousands, from the years 20002010. a. Let x represent time in years starting with x=1 for the year 2000. Let y represent the number of games sold in thousands. Use logarithmic regression to fit a model to these data. b. If games continue to sell at this rate, how many games will sell in 2015? Round to the nearest thousand.arrow_forwardWorld Population The following table shows world population N, in billions, in the given year. Year 1950 1960 1970 1980 1990 2000 2010 N 2.56 3.04 3.71 4.45 5.29 6.09 6.85 a. Use regression to find a logistic model for world population. b. What r value do these data yield for humans on planet Earth? c. According to the logistic model using these data, what is the carrying capacity of planet Earth for humans? d. According to this model, when will world population reach 90 of carrying capacity? Round to the nearest year. Note: This represents a rather naive analysis of world population.arrow_forwardWhat situations are best modeled by a logistic equation? Give an example, and state a case for why the example is a good fit.arrow_forward
- The number of Facebook users for each year from 2004 to 2016 can be found in the table below. Round all values to three decimal places. Year Users(in millions) 2004 1 2005 6 2006 12 2007 58 2008 145 2009 360 2010 608 2011 845 2012 1056 2013 1230 2014 1440 2015 1710 2016 2000 Using years since 2000, do both exponential and logistic regression and be sure to graph them and compare them to the scatterplot of the data. What model is the best fit to the data? exponential logistic What is the equation of the best fit model? What is the equation of the best fit model? Is that value reasonable or not? Explain why. Yes, the answer is reasonable. No, the answer is not reasonable.arrow_forwardThe numbers of polio cases in the world are shown in the table for various years. Year Number of Polio Cases (thousands) 1988 350 1992 138 1996 34 2000 3 2005 3.2 2007 1.3 Let f(t) be the number of polio cases in the world t years since 1980. Use a graphing calculator to draw a scattergram of the data. Is it better tamodel the data by using a linear or exponential model? Select an answer v Find an equation of f. Hint f(t) = Round the coefficients to 2 decimal places. The number of polio cases is Select an answer by Select an answer v per year. Predict the number of polio cases in 2018. Hint Predict in which year there will be 1 case of polio. Find the approximate half-life of the number of polio cases. Hint years Ouestion Helarrow_forwardThe number of Facebook users for each year from 2004 to 2016 can be found in the table below.Round all values to three decimal places. Year 2004 2005 2006 2007 2008 2009 2010 2011 2012 2013 2014 2015 2016 Users in millions 1 12 58 145 360 608 845 1056 1230 1440 1710 2000 Using years since 2000, do both exponential and logistic regression and be sure to graph them and compare them to the scatterplot of the data. What model is the best fit to the data? O exponential O logistic What is the equation of the best fit model? Based on this model, what will be the number of Facebook users in the year 2025? Is that value reasonable or not? Explain why. OYes, the answer is reasonable.arrow_forward
- The number of Facebook users for each year from 2004 to 2016 can be found in the table below.Round all values to three decimal places. Year 2004 2005 2006 | 2007 | 2008 || 2009 | 2010 2011 2012 | 2013 2014 | 2015 | 2016 Users 1 in millions 58 145 1056 1230 6. 12 360 608 845 1440 1710 2000 Using years since 2000, do both exponential and logistic regression and be sure to graph them and compare them to the scatterplot of the data. What model is the best fit to the data? exponential O logistic What is the equation of the best fit model? Based on this model, what will be the number of Facebook users in the year 2025? Is that value reasonable or not? Explain why. O Yes, the answer is reasonable. O No, the answer is not reasonable.arrow_forwardWhich of the following variables could be the dependent variable in a Logistic Regression? BMI Survival (yes or no) Grade in School All of the abovearrow_forwardIndicate whether the following are true or false. Explain true or false. a. If the explained variable is quantitative and all explanatory variables take values 0 or 1, a logistic regression model is most appropriate.arrow_forward
arrow_back_ios
SEE MORE QUESTIONS
arrow_forward_ios
Recommended textbooks for you

 Calculus For The Life SciencesCalculusISBN:9780321964038Author:GREENWELL, Raymond N., RITCHEY, Nathan P., Lial, Margaret L.Publisher:Pearson Addison Wesley,
 Functions and Change: A Modeling Approach to Coll...AlgebraISBN:9781337111348Author:Bruce Crauder, Benny Evans, Alan NoellPublisher:Cengage Learning
 Algebra & Trigonometry with Analytic GeometryAlgebraISBN:9781133382119Author:SwokowskiPublisher:Cengage
Calculus For The Life Sciences
Calculus
ISBN:9780321964038
Author:GREENWELL, Raymond N., RITCHEY, Nathan P., Lial, Margaret L.
Publisher:Pearson Addison Wesley,
Functions and Change: A Modeling Approach to Coll...
Algebra
ISBN:9781337111348
Author:Bruce Crauder, Benny Evans, Alan Noell
Publisher:Cengage Learning
Algebra & Trigonometry with Analytic Geometry
Algebra
ISBN:9781133382119
Author:Swokowski
Publisher:Cengage
Correlation Vs Regression: Difference Between them with definition & Comparison Chart; Author: Key Differences;https://www.youtube.com/watch?v=Ou2QGSJVd0U;License: Standard YouTube License, CC-BY
Correlation and Regression: Concepts with Illustrative examples; Author: LEARN & APPLY : Lean and Six Sigma;https://www.youtube.com/watch?v=xTpHD5WLuoA;License: Standard YouTube License, CC-BY