
Elementary Statistics ( 3rd International Edition ) Isbn:9781260092561
3rd Edition
ISBN: 9781259969454
Author: William Navidi Prof.; Barry Monk Professor
Publisher: McGraw-Hill Education
expand_more
expand_more
format_list_bulleted
Concept explainers
Videos
Textbook Question
Chapter 2.4, Problem 6E
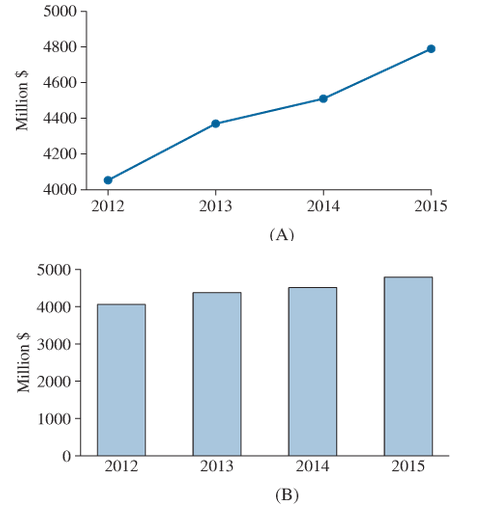
Music sales: The following time-series plot and bar graph both present the sales of digital music for the years 2012—2015. Which of the graphs presents the more accurate picture? Why?
Expert Solution & Answer
Want to see the full answer?
Check out a sample textbook solution
Students have asked these similar questions
Year
Missouri
Maine
1950
38800
29400
2000
89900
98700
If these trends were to continue, what would be the median home value in Missouri in 2010?
c) If we assume the linear trend existed before 1950 and continues after 2000, the two states' median house values will be (or were) equal in what year?
sam and ava compared the weights of their puppies each month during the first half of 2015. The graphs generated from this data are shown below
In retail, a store manager uses time series models to understand shopping trends.
Review the scatter plot of the store’s sales from 2010 through 2021 to answer the questions. See attached as image.
Here is the data for Fiscal Year and Sales:
Fiscal Year
Sales
2010
$260,123.00
2011
$256,853.00
2012
$274,366.00
2013
$290,525.00
2014
$322,318.00
2015
$380,921.00
2016
$541,925.00
2017
$909,050.00
2018
$1,817,521.00
2019
$3,206,564.00
2020
$4,921,005.00
2021
$5,686,338.00
Time series decomposition seeks to separate the time series (Y) into 4 components: trend (T), cycle (C), seasonal (S), and irregular (I). What is the difference between these components?
The model can be additive or multiplicative. When do you use each?
Review the scatter plot of the exponential trend of the time series data. Do you observe a trend? If so, what type of trend do you observe?
What predictions might you make about the store’s annual sales over the next few years?
Chapter 2 Solutions
Elementary Statistics ( 3rd International Edition ) Isbn:9781260092561
Ch. 2.1 - In Exercises 5-8, fill in each blank with the...Ch. 2.1 - In Exercises 5-8, fill in each blank with the...Ch. 2.1 - In Exercises 5-8, fill in each blank with the...Ch. 2.1 - In Exercises 5-8, fill in each blank with the...Ch. 2.1 - In Exercises 9—12, determine whether the...Ch. 2.1 - In Exercises 9—12, determine whether the...Ch. 2.1 - In Exercises 9—12, determine whether the...Ch. 2.1 - In Exercises 9—12, determine whether the...Ch. 2.1 - The following bar graph presents the average...Ch. 2.1 - The most common blood typing system divides human...
Ch. 2.1 - Following is a pie chart that presents the...Ch. 2.1 - Government spending: The following pie chart...Ch. 2.1 - U.S. population: The following side-by-side bar...Ch. 2.1 - Super Bowl: The following side-by-side bar graph...Ch. 2.1 - Smartphone sales: The following frequency...Ch. 2.1 - Popular video games: The following frequency...Ch. 2.1 - More smartphones: Using the data in Exercise 19:...Ch. 2.1 - More video games: Using the data in Exercise 20:...Ch. 2.1 - Hospital admissions: The following frequency...Ch. 2.1 - World population: Following are the populations of...Ch. 2.1 - Ages of video garners: The Nielsen Company...Ch. 2.1 - How secure is your job? In a survey, employed...Ch. 2.1 - Back up your data: In a survey commissioned by the...Ch. 2.1 - Education levels: The following frequency...Ch. 2.1 - Twitter followers: The following frequency...Ch. 2.1 - Music sales: The following frequency distribution...Ch. 2.1 - Keeping up with the Kardashians: The following...Ch. 2.1 - Bought a new car lately? The following table...Ch. 2.1 - Bought a new- truck lately? The following table...Ch. 2.1 - Happy Halloween: The following table presents...Ch. 2.1 - Native languages: The following frequency...Ch. 2.1 - Proportion of females: Following are the...Ch. 2.2 - Prob. 5ECh. 2.2 - In Exercises 5—8, fill in each blank with the...Ch. 2.2 - In Exercises 5—8, fill in each blank with the...Ch. 2.2 - In Exercises 5—8, fill in each blank with the...Ch. 2.2 - In Exercises 9—12, determine whether the...Ch. 2.2 - In Exercises 9—12, determine whether the...Ch. 2.2 - In Exercises 9—12, determine whether the...Ch. 2.2 - In Exercises 9—12, determine whether the...Ch. 2.2 - In Exercises 13—16, classify the histogram as...Ch. 2.2 - In Exercises 13—16, classify the histogram as...Ch. 2.2 - In Exercises 13—16, classify the histogram as...Ch. 2.2 - In Exercises 13—16, classify the histogram as...Ch. 2.2 - In Exercises 17 and 18, classify the histogram as...Ch. 2.2 - In Exercises 17 and 18, classify the histogram as...Ch. 2.2 - Student heights: The following frequency histogram...Ch. 2.2 - Trained rats: Forty rats were trained to run a...Ch. 2.2 - Cholesterol: The following histogram shows the...Ch. 2.2 - Blood pressure: The following histogram shows the...Ch. 2.2 - Olympic athletes: The following frequency...Ch. 2.2 - Hows the weather? The following relative frequency...Ch. 2.2 - Skewed which way? For which of the following data...Ch. 2.2 - Skewed which way? For which of the following data...Ch. 2.2 - Batting average: The following frequency...Ch. 2.2 - Batting average: The following frequency...Ch. 2.2 - Time spent playing video games: A sample of 200...Ch. 2.2 - Murder, she wrote: The following frequency...Ch. 2.2 - BMW prices: The following table presents the...Ch. 2.2 - Geysers: The geyser Old Faithful in Yellowstone...Ch. 2.2 - Hail to the chief: There have been 58 presidential...Ch. 2.2 - Internet radio: The following table presents the...Ch. 2.2 - Brothers and sisters: Thirty students in a...Ch. 2.2 - Cough, cough: The following table presents the...Ch. 2.2 - Prob. 37ECh. 2.2 - Prob. 38ECh. 2.2 - Prob. 39ECh. 2.2 - Prob. 40ECh. 2.2 - Frequency polygon: Using the data in Exercise 29:...Ch. 2.2 - Prob. 42ECh. 2.2 - Ogive: Using the data in Exercise 27: Compute the...Ch. 2.2 - Ogive: Using the data in Exercise 28: Compute the...Ch. 2.2 - Ogive: Using the data in Exercise 29: Compute the...Ch. 2.2 - Prob. 46ECh. 2.2 - Prob. 47ECh. 2.2 - Prob. 48ECh. 2.2 - Prob. 49ECh. 2.2 - Prob. 50ECh. 2.2 - Prob. 51ECh. 2.2 - Prob. 52ECh. 2.2 - Frequencies and relative frequencies: The...Ch. 2.3 - In Exercises 3—6, fill in each blank with the...Ch. 2.3 - In Exercises 3—6, fill in each blank with the...Ch. 2.3 - In Exercises 3—6, fill in each blank with the...Ch. 2.3 - In Exercises 3—6, fill in each blank with the...Ch. 2.3 - Prob. 7ECh. 2.3 - In Exercises 7—10, determine whether the...Ch. 2.3 - In Exercises 7—10, determine whether the...Ch. 2.3 - In Exercises 7—10, determine whether the...Ch. 2.3 - Construct a stem-and-leaf plot for the following...Ch. 2.3 - Construct a stem-and-leaf plot for the following...Ch. 2.3 - List the data in the following stem-and-leaf plot....Ch. 2.3 - List the data in the following stein-and-leaf...Ch. 2.3 - Construct a dotplot for the data in Exercise 11.Ch. 2.3 - Prob. 16ECh. 2.3 - BMW prices: The following table presents the...Ch. 2.3 - Hows the weather? The following table presents the...Ch. 2.3 - Air pollution: The following table presents...Ch. 2.3 - Technology salaries: The following table presents...Ch. 2.3 - Tennis and golf: Following are the ages of the...Ch. 2.3 - Pass the popcorn: Following are the running times...Ch. 2.3 - More weather: Construct a dotplot for the data in...Ch. 2.3 - Prob. 24ECh. 2.3 - Looking for a job: The following table presents...Ch. 2.3 - Prob. 26ECh. 2.3 - Military spending: The following table presents...Ch. 2.3 - Prob. 28ECh. 2.3 - Dining out: The following time-series plot...Ch. 2.3 - Prob. 30ECh. 2.3 - Prob. 31ECh. 2.3 - More gold: The following time series plot presents...Ch. 2.3 - Prob. 33ECh. 2.3 - Prob. 34ECh. 2.3 - Vote: The following time-series plot presents the...Ch. 2.3 - Arctic ice sheet: The following table presents the...Ch. 2.3 - Prob. 37ECh. 2.4 - In Exercises 3 and 4, fill in each blank with the...Ch. 2.4 - In Exercises 3 and 4, fill in each blank with the...Ch. 2.4 - CD sales decline: Sales of CDs have been declining...Ch. 2.4 - Music sales: The following time-series plot and...Ch. 2.4 - Stock market prices: The Dow Jones Industrial...Ch. 2.4 - Save your money: In 2007, U.S. residents saved...Ch. 2.4 - Ill take mine with mustard: The following bar...Ch. 2.4 - Stream or download? The following bar graph...Ch. 2.4 - Female senators: Of the 100 members of the United...Ch. 2.4 - Age at marriage: Data compiled by the U.S. Census...Ch. 2.4 - College degrees: Both of the following time-series...Ch. 2.4 - Food expenditures: Both of the following...Ch. 2.4 - Prob. 15ECh. 2 - Following is the list of letter grades for...Ch. 2 - Prob. 2CQCh. 2 - Construct a frequency bar graph for the data in...Ch. 2 - Prob. 4CQCh. 2 - Prob. 5CQCh. 2 - Prob. 6CQCh. 2 - Prob. 7CQCh. 2 - Prob. 8CQCh. 2 - Prob. 9CQCh. 2 - Prob. 10CQCh. 2 - Following are the prices (in dollars) for a sample...Ch. 2 - Prob. 12CQCh. 2 - Prob. 13CQCh. 2 - Prob. 14CQCh. 2 - Prob. 15CQCh. 2 - Trust your doctor: The General Social Survey...Ch. 2 - Internet browsers: The following relative...Ch. 2 - Prob. 3RECh. 2 - Prob. 4RECh. 2 - Prob. 5RECh. 2 - House freshmen: Newly elected members of the U.S....Ch. 2 - More freshmen: For the data in Exercise 6:...Ch. 2 - Royalty: Following are the ages at death for all...Ch. 2 - Prob. 9RECh. 2 - Prob. 10RECh. 2 - Prob. 11RECh. 2 - Prob. 12RECh. 2 - Prob. 13RECh. 2 - Prob. 14RECh. 2 - Prob. 15RECh. 2 - Explain why the frequency bar graph and the...Ch. 2 - Prob. 2WAICh. 2 - Prob. 3WAICh. 2 - Prob. 4WAICh. 2 - Prob. 5WAICh. 2 - In the chapter introduction, we presented gas...Ch. 2 - In the chapter introduction, we presented gas...Ch. 2 - In the chapter introduction, we presented gas...Ch. 2 - Prob. 4CSCh. 2 - In the chapter introduction, we presented gas...Ch. 2 - Prob. 6CSCh. 2 - In the chapter introduction, we presented gas...Ch. 2 - Prob. 8CSCh. 2 - In the chapter introduction, we presented gas...
Knowledge Booster


Learn more about
Need a deep-dive on the concept behind this application? Look no further. Learn more about this topic, statistics and related others by exploring similar questions and additional content below.Similar questions
- The US. import of wine (in hectoliters) for several years is given in Table 5. Determine whether the trend appearslinear. Ifso, and assuming the trend continues, in what year will imports exceed 12,000 hectoliters?arrow_forwardUse this data for the exercises that follow: In 2013, there were roughly 317 million citizens in the United States, and about 40 million were elderly (aged 65 and over).[34] 60. It is predicted that by 2030, one in five U.S. citizens will be elderly. How much greater will the chances of meeting an elderly person be at that time? What policy changes do you foresee if these statistics hold true?arrow_forwardAn electronic appliance manufacturer wants to know if there is a relationship between percentage change in deposable personal income which is reported quarterly by the government, and the percentage change in appliances sold by the manufacturer following same years of quarterly data. Brenda Chee and Clarence Paulus lead an analyst team has obtained data for the past 10 quarters. (Hint: Provides your answers in two decimal points) Quarter Percent change in income Percent Change in appliance sold Quarter Percent change in income Percent change in appliance sold 1 -2.3 -2.5 6 -1.0 1.0 2 -1.5 -1.0 7 0.7 1.4 3 2.8 7.4 8 5.2 3.4 4 0.5 2.6 9 -2.5 -0.5 5 4.6 8.5 10 1.7 1.8 (a) What forecasting model should be used for this data. Why?(5(b) Develop the forecasting model that you have proposed in (a).(c) Compute the relationship for these data. In your opinion, is the relationship between independentvariable…arrow_forward
- The diversity index, from 0 to 100, measures the chance that two randomly selected people are a different race or ethnicity. The diversity index in the United States varies widely from region to region, from as high as 81 in Hawaii to as low as 11 in Vermont. The bar graph shows the national diversity index for the United States for four years in the period from 1980 through 2010.The data in the graph can be modeled by the formulaD = 0.005x2 + 0.55x + 34,where D is the national diversity index in the United States x years after 1980. According to the formula, what was the U.S. diversity index in 2010? How does this compare with the index displayed by the bar graph?arrow_forwardThe following table gives data on quit rates per 100 employees in manufacturing and the unemployment rate in manufacturing in the U.S. for the period 1966-1971. Use the data to answer the following questions: Year Quit Rate (%), Y Unemployment Rate (%), X 1966 3 3 1967 2 4 1968 3 3 1969 3 3 1970 2 6 1971 2 7arrow_forwardIf the year-end price of a stock rises from $20 in 2001 to $40 in 2002 and then stays at $40 in 2003, the geometric mean of the price growth is closest to: a. 50% b. 45.41% C. 41.42% d. 30.10%arrow_forward
- Year Gross Federal Debt ($millions) 1945 260,123 1950 256,853 1955 274,366 1960 290,525 1965 322,318 1970 380,921 1975 541,925 1980 909,050 1985 1,817,521 1990 3,206,564 1995 4,921,005 2000 5,686,338 Construct a scatter plot with this data. Do you observe a trend? If so, what type of trend do you observe? Use Excel to fit a linear trend and an exponential trend to the data. Display the models and their respective r^2. Interpret both models. Which model seems to be more appropriate? Why?arrow_forwardFor the following description of data, identify Who and Whatwere investigated and the population of interest. A researcher wondered whether drivers treat bicycle riders differently when they wear helmets. He rigged his bicycle with an ultrasonic sensor that could measure how close each car was that passed him. He then rode on alternating days with and without a helmet. Of the 4000 times that a car passed him, he found that when he wore his helmet, motorists passed 3.07 inches closer to him, on average, than when his head was bare. What is the Who in this study? That is, identify the cases under study.arrow_forwardthe values of alabama building contracts (in $ millions) for a 12-month period follow.240 350 230 260 280 320 220 310 240 310 240 230a. construct a time series plot. What type of pattern exists in the data?arrow_forward
- im trying to produce a relative distribution graph for the number of road accidents and the time of day. originally ,i was using a graph where the time segments were 'morning (6 AM - 12 PM), afternoon (12 PM - 6 PM), evening (6 PM - 12 AM), and night (12 AM - 6 AM) ' but now i want to adjust the time segments to Morning (Peak): 7:00 AM - 10:00 AM Late Morning: 10:00 AM - 12:00 PM Afternoon (Off-peak): 12:00 PM - 2:59 PM school&work: 3:00 PM - 7:00 PM (this is the time people would be picking up their kids from school and people whould be ending work) Evening (Off-peak): 7:00 PM - 11:59 PM Late Night: 12:00 AM - 4:59 AM both graphs with these two different sets of time segments are linked to this question 1)i wish to know for a relative distribution, if its okay that my hour ranges are no longer equal like they were with the yellow graph and also if its okay that i have left out 5AM-7AM on my graph or is it important to include all hours of the day? 2) what analysis would you…arrow_forwardim trying to produce a relative distribution graph for the number of road accidents and the time of day. originally ,i was using a graph where the time segments were 'morning (6 AM - 12 PM), afternoon (12 PM - 6 PM), evening (6 PM - 12 AM), and night (12 AM - 6 AM) ' but now i want to adjust the time segments to Morning (Peak): 7:00 AM - 10:00 AM Late Morning: 10:00 AM - 12:00 PM Afternoon (Off-peak): 12:00 PM - 2:59 PM school&work: 3:00 PM - 7:00 PM (this is the time people would be picking up their kids from school and people whould be ending work) Evening (Off-peak): 7:00 PM - 11:59 PM Late Night: 12:00 AM - 4:59 AM both graphs with these two different sets of time segments are linked to this question 1)i wish to know for a relative distribution, if its okay that my hour ranges are no longer equal like they were with the yellow graph and also if its okay that i have left out 5AM-7AM on my graph or is it important to include all hours of the day? 2) what analysis would you…arrow_forwardAn auctioneer of antique Iranian rugs kept records of his weekly auctions in order to determine the relationships among price, age of carpet or rug, number of people attending the auction, and the number of times the winning bidder had previously attended his auctions. He felt that, with this information, he could plan his auctions better, serve his steady customers better, and make a higher overall profit for himself.arrow_forward
arrow_back_ios
SEE MORE QUESTIONS
arrow_forward_ios
Recommended textbooks for you

 College AlgebraAlgebraISBN:9781305115545Author:James Stewart, Lothar Redlin, Saleem WatsonPublisher:Cengage Learning
 Big Ideas Math A Bridge To Success Algebra 1: Stu...AlgebraISBN:9781680331141Author:HOUGHTON MIFFLIN HARCOURTPublisher:Houghton Mifflin Harcourt
 Glencoe Algebra 1, Student Edition, 9780079039897...AlgebraISBN:9780079039897Author:CarterPublisher:McGraw Hill
 Functions and Change: A Modeling Approach to Coll...AlgebraISBN:9781337111348Author:Bruce Crauder, Benny Evans, Alan NoellPublisher:Cengage Learning
College Algebra
Algebra
ISBN:9781305115545
Author:James Stewart, Lothar Redlin, Saleem Watson
Publisher:Cengage Learning
Big Ideas Math A Bridge To Success Algebra 1: Stu...
Algebra
ISBN:9781680331141
Author:HOUGHTON MIFFLIN HARCOURT
Publisher:Houghton Mifflin Harcourt
Glencoe Algebra 1, Student Edition, 9780079039897...
Algebra
ISBN:9780079039897
Author:Carter
Publisher:McGraw Hill
Functions and Change: A Modeling Approach to Coll...
Algebra
ISBN:9781337111348
Author:Bruce Crauder, Benny Evans, Alan Noell
Publisher:Cengage Learning
The Shape of Data: Distributions: Crash Course Statistics #7; Author: CrashCourse;https://www.youtube.com/watch?v=bPFNxD3Yg6U;License: Standard YouTube License, CC-BY
Shape, Center, and Spread - Module 20.2 (Part 1); Author: Mrmathblog;https://www.youtube.com/watch?v=COaid7O_Gag;License: Standard YouTube License, CC-BY
Shape, Center and Spread; Author: Emily Murdock;https://www.youtube.com/watch?v=_YyW0DSCzpM;License: Standard Youtube License