
Videos
a.
To construct: The 95% confidence interval for the proportion of students who have used drugs more than one time in a given month to stay awake.
a.
Answer to Problem 25.32E
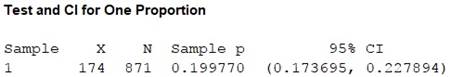
The 95% confidence interval for the proportion of students who have used drugs more than one time in a given month to stay awake is 0.173695 to 0.227894.
Explanation of Solution
Given info:
The data shows the association between the sleep quality classification and the use of over-the-counter (OTC) or prescription (RX) stimulant medication more than once a month to help keep them awake.
Calculation:
Let
Thus, the proportion of students who have used drugs more than one time in a given month to stay awake is 0.1998.
Software procedure:
Step-by-step procedure for constructing 95% confidence interval for the given proportion is shown below:
- Click on Stat, Basic statistics and 1-proportion.
- Choose Summarized data, under Number of
events enter 174, under Number of trials enter 871. - Click on options, choose 95% confidence interval.
- Click ok.
Output using MINITAB is given below:
Conclusion:
The 95% confidence interval for the proportion of students who have used drugs more than one time in a given month to stay awake is 0.173695 to 0.227894.
b.
To find: The conditional distribution for the sleep quality of the students who have used drugs and those who haven’t.
To construct: A graph that compares the two conditional distributions.
To describe: The relationship between the students who have used drugs to stay awake and students who haven’t used drugs to stay awake.
b.
Answer to Problem 25.32E
The conditional distribution for the sleep quality of the students who have used the drugs and those who haven’t used the drugs is given below:
| Sleep Quality | Conditional distributionof sleep quality for students who have used drugs | Conditional distribution of sleep quality for students who haven’t used drugs |
| Optimal | 12.2 | 87.8 |
| Borderline | 22.2 | 77.8 |
| Poor | 25.5 | 74.5 |
Output obtained from MINITAB is given below:
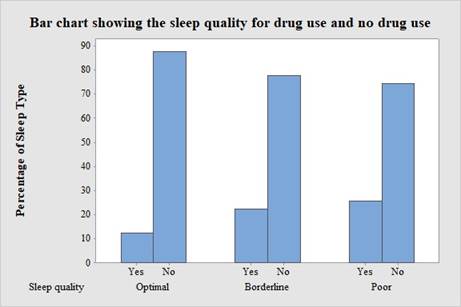
The students who have consumed drugs have less amount of optimal sleep than students who haven’t consumed drugs. Thus, consuming drugs helps the students to stay awake.
Explanation of Solution
Calculation:
The conditional distribution for the sleep quality of the students who have used the drugs is calculated as follows:
The conditional distribution for the sleep quality of the students who haven’t used the drugs is calculated as follows:
The two conditional distributions are given below:
| Sleep Quality | Conditional distributionof sleep quality for students who have used drugs | Conditional distribution of sleep quality for students who haven’t used drugs |
| Optimal | ||
| Borderline | ||
| Poor |
Software procedure:
Step-by-step procedure for constructing a bar graph for comparing the two conditional distributions is given below:
- Click on Graph, select Bar Chart.
- Under Bar represent: select Values from table.
- In Two-way table select Cluster and then click ok.
- In Graph variables, enter the columns of Yes and No.
- In Row labels, select Sleep quality.
- Under Table Arrangement, select Rows are outermost categories and columns are innermost.
- Click ok.
Interpretation:
The bar graph is constructed for the conditional distributions of sleep quality for students who have used drugs and students who haven’t used the drugs.
The bars are separated into three sets; the bars to the leftmost side represent the “Optimal” sleep quality, the bars placed in the middle represent the “Borderline” sleep quality, and the bars placed to the rightmost side represent the “Poor” sleep quality.
Justification:
From the conditional distributions and the bar graph, it can be observed that students who have consumed drugs have less amount of optimal sleep than students who haven’t consumed drugs.
Thus, consuming drugs help the students to stay awake.
c.
To test: Whether students who use drugs more than one time in a month to stay awake have a difference in sleep quality than the students who don’t use drugs.
To state: The hypotheses used for testing.
To give: The P-value and the conclusion.
c.
Answer to Problem 25.32E
There is a significant difference in the sleep quality between the students who have used the drugs and the students who don’t use drugs.
The hypotheses used for testing is given below:
The P-value is 0.000.
The drugs help the students to stay awake.
Explanation of Solution
Calculation:
The claim is to test whether there is any significant difference between the sleep quality of the students who have used the drugs and students who haven’t used the drugs.
Cell frequency for using Chi-square test:
- When at most 20% of the cell frequencies are less than 5
- If all the individual frequencies are 1 or more than 1.
- All the expected frequencies must be 5 or greater than 5.
The hypotheses used for testing is given below:
Software procedure:
Step-by-step procedure for calculating the chi-square test statistic is given below:
- Click on Stat, select Tables and then click on Chi-square Test of Association.
- Select Summarized data in a two-way table.
- Under Columns containing the table: enter the columns of Optimal, Borderline and Poor.
- Under Labels for the table (optional), select Drug Usage in the Rows: box and type Sleep Quality for the Column category name.
- Under statistics, click on Chi-square test.
- Click on ok.
Output obtained from MINITAB is given below:
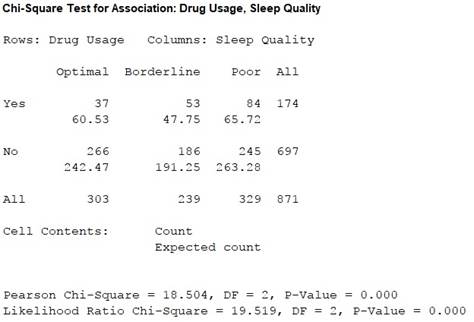
Thus, the test statistic is 18.504 and the P-value is 0.000.
Since all the expected frequencies are greater than 5,the usage of chi-square test is appropriate.
Conclusion:
The P-value is 0.000 and the level of significance is 0.05.
Here, the P-value is lesser than the level of significance.
Therefore, the null hypothesis is rejected.
Thus, there is strong evidence that there is a relationship between the sleep quality and drug usage.
Hence, students who have used the drugs have a low level of optimal sleep thanthe students who didn’t use the drugs. Thus, drugs help the students to stay awake.
Want to see more full solutions like this?
Chapter 25 Solutions
Bundle: Basic Practice of Statistics 7e & LaunchPad (Twelve Month Access)


 MATLAB: An Introduction with ApplicationsStatisticsISBN:9781119256830Author:Amos GilatPublisher:John Wiley & Sons Inc
 Probability and Statistics for Engineering and th...StatisticsISBN:9781305251809Author:Jay L. DevorePublisher:Cengage Learning
 Statistics for The Behavioral Sciences (MindTap C...StatisticsISBN:9781305504912Author:Frederick J Gravetter, Larry B. WallnauPublisher:Cengage Learning
 Elementary Statistics: Picturing the World (7th E...StatisticsISBN:9780134683416Author:Ron Larson, Betsy FarberPublisher:PEARSON
 The Basic Practice of StatisticsStatisticsISBN:9781319042578Author:David S. Moore, William I. Notz, Michael A. FlignerPublisher:W. H. Freeman
 Introduction to the Practice of StatisticsStatisticsISBN:9781319013387Author:David S. Moore, George P. McCabe, Bruce A. CraigPublisher:W. H. Freeman