
Concept explainers
Videos
a.
To test and conclude: Whether there is a relationship between the highest degrees obtained and attended religious services.
a.
Answer to Problem 25.43E
There is sufficient evidence to support the claim that there is a relationship between the highest degrees obtained and attended religious services. That is, the attending religious service has effect on getting degrees.
Explanation of Solution
Given info:
The statement “Did any one attended religious services last week” was asked to randomly selected subjects.
Calculation:
The claim is to test whether there is any relationship between the highest degrees obtained and attended religious services.
Cell frequency for using Chi-square test:
When at most 20% of the cell frequencies are less than 5
If all the individual frequencies are 1 or more than 1.
All the expected frequencies must be 5 or greater than 5
The hypotheses used for testing are given below:
Software procedure:
Software procedure for calculating the chi-square test statistic is given below:
Click on Stat, select Tables and then click on Chi-square Test (Two-way table in a worksheet).
Under Columns containing the table: enter the columns of High School, Junior College, Bachelor, and Graduate.
Click ok.
Output obtained from MINITAB is given below:
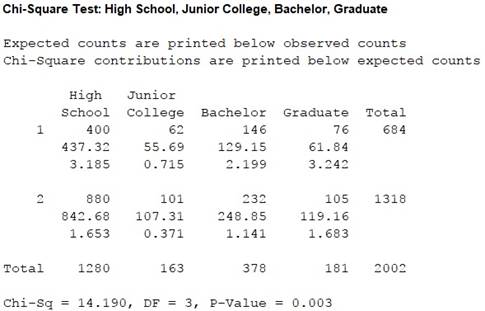
Thus, the test statistic is 14.190, the degree of freedom is 3 and the P-value is 0.003.
Since all the expected frequencies are greater than 5, the usage of chi-square test is appropriate.
Conclusion:
The P-value is 0.003 and level of significance is 0.05.
Thus, the P-value is lesser than the level of significance.
The null hypothesis is rejected.
Thus, there is sufficient evidence to support the claim that there is a relationship between the highest degrees obtained and attended religious services.
b.
To make: A
To test: Whether there is relationship between the types of highest degrees obtained and attended religious services and describes the result.
b.
Answer to Problem 25.43E
The
| Highest degree obtained | |||
| Attended Services | Junior College | Bachelor | Graduate |
| Yes | 62 | 146 | 76 |
| No | 101 | 232 | 105 |
There is no sufficient evidence to support the claim that there is relationship between the types of highest degrees obtained and attended religious services.
The relationship between the types of highest degrees obtained and attended religious services changes.
Explanation of Solution
Calculation:
The claim is to test whether there is any relationship between the types of highest degrees obtained and attended religious services.
The hypotheses used for testing are given below:
Software procedure:
Software procedure for calculating the chi-square test statistic is given below:
- Click on Stat, select Tables and then click on Chi-square Test (Two-way table in a worksheet).
- Under Columns containing the table: enter the columns of Junior College, Bachelor, and Graduate.
- Click ok.
Output obtained from MINITAB is given below:
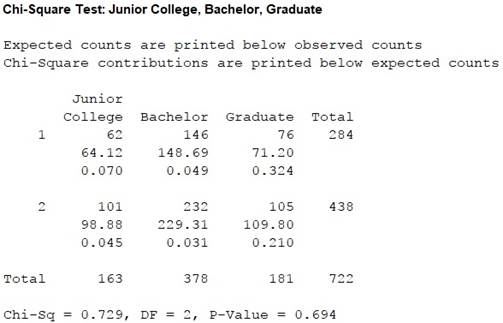
Thus, the test statistic is 0.729, the degree of freedom is 2 and the P-value is 0.694.
Since all the expected frequencies are greater than 5, the usage of chi-square test is appropriate.
Conclusion:
The P-value is 0.694 and level of significance is 0.05
Thus, the P-value is greater than the level of significance.
The null hypothesis is not rejected.
Thus, there is no sufficient evidence to support the claim that there is relationship between the types of highest degrees obtained and attended religious services.
When the High school degree column is omitted, the relationship between the types of highest degrees obtained and attended religious services do not exist.
c.
To make: A
To test: Whether there is relationship between getting a degree beyond high school and attended religious services.
c.
Answer to Problem 25.43E
The
| Highest Degree obtained | ||
| Attended Services | High School | Degrees beyond High School |
| Yes | 62 | 284 |
| No | 101 | 438 |
There is not sufficient evidence to support the claim that there is relationship between getting a degree beyond high school and attended religious services
There is no influence of attending religious services on getting highest degree hold.
Explanation of Solution
Calculation:
A two way table by adding the columns of “Junior School”, “Bachelor” and “Graduate” is given below:
| Highest Degree obtained | ||||
| Attended Services | Junior College | Bachelor | Graduate | Total |
| Yes | 62 | 146 | 76 | 284 |
| No | 101 | 232 | 105 | 438 |
Thus, combining the total obtained from the above table and the column of “High school”. The
| Highest Degree obtained | ||
| Attended Services | High School | Degrees beyond High School |
| Yes | 62 | 284 |
| No | 101 | 438 |
The claim is to test whether there is any relationship between getting a degree beyond high school and attended religious services.
The hypotheses used for testing are given below:
Software procedure:
Step by step procedure for calculating the chi-square test statistic using MINITAB software.
- Click on Stat, select Tables and then click on Chi-square Test (Two-way table in a worksheet).
- Under Columns containing the table: enter the columns of High School and Degree beyond high school.
- Click ok.
Output obtained from MINITAB is given below:
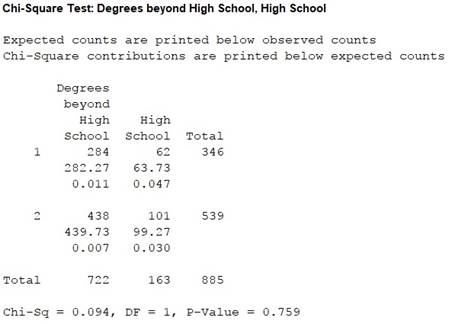
Thus, the test statistic is 0.094, the degree of freedom is 1 and the P-value is 0.759.
Since all the expected frequencies are greater than 5, the usage of chi-square test is appropriate.
Conclusion:
The P-value is 0.759 and level of significance is 0.05
Thus, the P-value is greater than the level of significance.
The null hypothesis is not rejected.
Thus, there is no sufficient evidence to support the claim that there is a relationship between getting a degree beyond high school and attended religious services.
d.
To explain: The relationship between the highest degree obtained and attending religious services in part (a), (b) and (c).
To find: The percentage who attended religious services across each category of highest degree obtained.
d.
Answer to Problem 25.43E
The relationship between the highest degree obtained and attending religious services depends on the individuals or the samples because High school people have higher percentage in attending religious service.
After omitting the “High School” column, the analysis shows no relationship between the highest degree obtained and attending religious services.
The percentage who attended religious services across each category of highest degree is given below:
| Highest Degree Hold | Percentage of Attended services |
| High School | 58.5% |
| Junior College | 9.1% |
| Bachelor | 21.3% |
| Graduate | 11.1% |
Explanation of Solution
From the analysis obtained in part (a), there is a relationship between the attended religious services and highest degree.
From the analysis obtained in part (b), there is no relationship between the attended religious services and highest degree because the column “High school” is left out from the analysis.
From the analysis obtained in part (c), there is no relationship between the attended religious services and highest degree because the columns of “Junior School”, “Bachelor” and “Graduate” and the analysis was carried out.
The above result shows that the highest degree is affected by attending religious services.
Calculation:
The percentage who attended religious services across each category of highest degree is calculated below:
| Highest Degree Hold | Percentage of Attended services |
| High School | |
| Junior College | |
| Bachelor | |
| Graduate |
Want to see more full solutions like this?
Chapter 25 Solutions
Bundle: Basic Practice of Statistics 7e & LaunchPad (Twelve Month Access)


 MATLAB: An Introduction with ApplicationsStatisticsISBN:9781119256830Author:Amos GilatPublisher:John Wiley & Sons Inc
 Probability and Statistics for Engineering and th...StatisticsISBN:9781305251809Author:Jay L. DevorePublisher:Cengage Learning
 Statistics for The Behavioral Sciences (MindTap C...StatisticsISBN:9781305504912Author:Frederick J Gravetter, Larry B. WallnauPublisher:Cengage Learning
 Elementary Statistics: Picturing the World (7th E...StatisticsISBN:9780134683416Author:Ron Larson, Betsy FarberPublisher:PEARSON
 The Basic Practice of StatisticsStatisticsISBN:9781319042578Author:David S. Moore, William I. Notz, Michael A. FlignerPublisher:W. H. Freeman
 Introduction to the Practice of StatisticsStatisticsISBN:9781319013387Author:David S. Moore, George P. McCabe, Bruce A. CraigPublisher:W. H. Freeman