
Principles of Economics 2e
2nd Edition
ISBN: 9781947172364
Author: Steven A. Greenlaw; David Shapiro
Publisher: OpenStax
expand_more
expand_more
format_list_bulleted
Textbook Question
Chapter 25, Problem 3SCQ
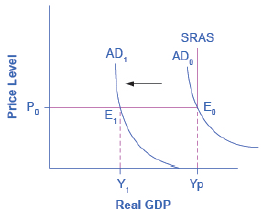
Use the AD/AS model to explain bow an inflationary gap occurs, beginning from the initial equilibrium in Figure 25.6.

Expert Solution & Answer
Want to see the full answer?
Check out a sample textbook solution
Students have asked these similar questions
Only #4 please, Use a graph please if needed to help prove
a-c
For these questions, you must state "true," "false," or "uncertain" and argue your case (roughly 3
to 5 sentences). When appropriate, the use of graphs will make for stronger answers. Credit will
depend entirely on the quality of your explanation.
1. If the industry facing regulation for its pollutant emissions has a lot of political capital, direct
regulatory intervention will be more viable than an emissions tax to address this market
failure.
2. A stated-preference method will provide a measure of the value of Komodo dragons that is
more accurate than the value estimated through application of the travel cost model to
visitation data for Komodo National Park in Indonesia.
3. A correlation between community demographics and the present location of polluting
facilities is sufficient to claim a violation of distributive justice.
olsvrc
Q
4. When the damages from pollution are uncertain, a price-based mechanism is best equipped to
manage the costs of the regulator's imperfect…
Chapter 25 Solutions
Principles of Economics 2e
Ch. 25 - In the Keynesian framework, which of the following...Ch. 25 - In a Keynesian framework, using an AD/AS diagram,...Ch. 25 - Use the AD/AS model to explain bow an inflationary...Ch. 25 - Suppose the U.S. Congress cuts federal government...Ch. 25 - How would a decrease in energy prices affect the...Ch. 25 - Does Keynesian economics require government to set...Ch. 25 - List three practical problems with the Keynesian...Ch. 25 - Name some economic events not related to...Ch. 25 - Name some government policies that cod cause...Ch. 25 - From a Keynesian point of view, which is more...
Ch. 25 - Why do sticky wages and prices increase the impact...Ch. 25 - Explain what economists mean by menu costs.Ch. 25 - What tradeoff does a Phillips curve show?Ch. 25 - Would you expect to see long-run data trace out a...Ch. 25 - What is the Keynesian prescription for recession?...Ch. 25 - How did the Keynesian perspective address the...Ch. 25 - In its recent report, The Conference Boards Global...Ch. 25 - What may happen if growth in China continues or...Ch. 25 - Does it make sense that wages would be sticky...Ch. 25 - Suppose the economy is operating at potential GDP...Ch. 25 - Do you think the Phillips curve is a useful tool...Ch. 25 - Return to the table from the Economic Report of...Ch. 25 - Explain what types of policies the federal...
Additional Business Textbook Solutions
Find more solutions based on key concepts
The cost of capital. Introduction: The cost of capital is the opportunity cost involved in making a specific in...
Gitman: Principl Manageri Finance_15 (15th Edition) (What's New in Finance)
To what does the lifetime value of the customer refer, and how is it calculated?
MARKETING:REAL PEOPLE,REAL CHOICES
(Capital asset pricing model) Using the CAPM, estimate the appropriate required rate of return for the three st...
Foundations Of Finance
Discussion Questions 1. What characteristics of the product or manufacturing process would lead a company to us...
Managerial Accounting (5th Edition)
S6-2 Determining inventory costing methods
Ward Hard ware does not expect costs to change dramatically and want...
Horngren's Financial & Managerial Accounting, The Financial Chapters (Book & Access Card)
Consider the sales data for Computer Success given in Problem 7. Use a 3-month weighted moving average to forec...
Operations Management: Processes and Supply Chains (12th Edition) (What's New in Operations Management)
Knowledge Booster

Similar questions
- For environmental economics, question number 2 only please-- thank you!arrow_forwardFor these questions, you must state "true," "false," or "uncertain" and argue your case (roughly 3 to 5 sentences). When appropriate, the use of graphs will make for stronger answers. Credit will depend entirely on the quality of your explanation. 1. If the industry facing regulation for its pollutant emissions has a lot of political capital, direct regulatory intervention will be more viable than an emissions tax to address this market failure. cullog iba linevoz ve bubivorearrow_forwardExercise 3 The production function of a firm is described by the following equation Q=10,000-3L2 where L stands for the units of labour. a) Draw a graph for this equation. Use the quantity produced in the y-axis, and the units of labour in the x-axis. b) What is the maximum production level? c) How many units of labour are needed at that point? d) Provide one reference with you answer.arrow_forward
- Exercise 1 Consider the market supply curve which passes through the intercept and from which the market equilibrium data is known, this is, the price and quantity of equilibrium PE=50 and QE=2000. Considering those two points, find the equation of the supply. Draw a graph of this line. Provide one reference with your answer. Exercise 2 Considering the previous supply line, determine if the following demand function corresponds to the market demand equilibrium stated above. QD=3000-2p.arrow_forwardConsider the market supply curve which passes through the intercept and from which the marketequilibrium data is known, this is, the price and quantity of equilibrium PE=50 and QE=2000.a. Considering those two points, find the equation of the supply. b. Draw a graph of this line.arrow_forwardGovernment Purchases and Tax Revenues A B GDP T₂ Refer to the diagram. Discretionary fiscal policy designed to slow the economy is illustrated by Multiple Choice the shift of curve T₁ to T2. a movement from d to balong curve T₁.arrow_forward
- Section III: Empirical Findings: Descriptive Statistics and inferential statistics………………..40% Descriptive statistics provide details about the Y variable, based on the sample for the 10-year period. Here, you use Excell or manually compute Mean or the average income per capita. Interpret the meaning of average income per capita. Draw the line chart showing the educational performance over the time-period of your study. Label the Vertical axis as Y performance and X axis as the explanatory variable (X1) . Do the same thing between Y and X2 Empirical/ Inferential Statistics: Here, use the sample information to perform the following: Draw the Scatter plot and impose the trend line: showing the Y variable and explanatory variables ( X1). Draw the scatter plot and impose the tend line: Showing Y and X2. Does your evidence (data) support your theory? Refer to the trend line: Is the relationship positive or negative as expected? Based on the data sheet below: Years Y ( per…arrow_forwardSection III: Empirical Findings: Descriptive Statistics and inferential statistics………………..40% Descriptive statistics provide details about the Y variable, based on the sample for the 10-year period. Here, you use Excell or manually compute Mean or the average income per capita. Interpret the meaning of average income per capita. Draw the line chart showing the educational performance over the time-period of your study. Label the Vertical axis as Y performance and X axis as the explanatory variable (X1) . Do the same thing between Y and X2 Empirical/ Inferential Statistics: Here, use the sample information to perform the following: Draw the Scatter plot and impose the trend line: showing the Y variable and explanatory variables ( X1). Draw the scatter plot and impose the tend line: Showing Y and X2. Does your evidence (data) support your theory? Refer to the trend line: Is the relationship positive or negative as expected? Create graphs based on table below; Years Y ( per…arrow_forwardPlease help me with this Accounting questionarrow_forward
- Title: Does the educational performance depend on its literacy rate and government spending over the last 10 years? In the introduction, there are four things to include:a) Clearly state your research topic follows by country’s background in terms of (population density; male/female ratio; and identify the problem leading up to the study of it, such as government spending and adult literacy rate. How does the US perform compared to other countries.b) State the research question that you wish to resolve: Does the US economic performance depend on its government spending on education and the literacy rate over the last 10 years. Define performance (Y) as the average income per capita, an indicator of the country’s economy growing over time. For example, an increase in government spending leads to higher literacy rates and subsequently higher productivity in the economy. Also, mention that you will use a sample size of 10 years of secondary data from the existing literature,…arrow_forwardTitle: Does the educational performance depend on its literacy rate and government spending over the last 10 years? In the introduction, there are four things to include:a) Clearly state your research topic follows by country’s background in terms of (population density; male/female ratio; and identify the problem leading up to the study of it, such as government spending and adult literacy rate. How does the US perform compared to other countries.b) State the research question that you wish to resolve: Does the US economic performance depend on its government spending on education and the literacy rate over the last 10 years. Define performance (Y) as the average income per capita, an indicator of the country’s economy growing over time. For example, an increase in government spending leads to higher literacy rates and subsequently higher productivity in the economy. Also, mention that you will use a sample size of 10 years of secondary data from the existing literature,…arrow_forwardExplain how the introduction of egg replacers and plant-based egg products will impact the bakery industry. Provide a graphical representation.arrow_forward
arrow_back_ios
SEE MORE QUESTIONS
arrow_forward_ios
Recommended textbooks for you
 Principles of Economics 2eEconomicsISBN:9781947172364Author:Steven A. Greenlaw; David ShapiroPublisher:OpenStax
 Economics (MindTap Course List)EconomicsISBN:9781337617383Author:Roger A. ArnoldPublisher:Cengage Learning


Principles of Economics 2e
Economics
ISBN:9781947172364
Author:Steven A. Greenlaw; David Shapiro
Publisher:OpenStax
Economics (MindTap Course List)
Economics
ISBN:9781337617383
Author:Roger A. Arnold
Publisher:Cengage Learning