
Concept explainers
Videos
In the descriptions of experiments given in Exercises 2.15–2.18, identify the important features of each design. Include as many of the components listed in Exercise 2.14 as needed to adequately describe the design.
2.17 In place of the design described in Exercise 2.16, make the following change. Within each hospital, the three treatments will be randomly assigned to the patients, with two patients in each ward receiving D1, two patients receiving D2, and two patients receiving the placebo.
2.14 The process engineer designed a study to evaluate the quality of plastic irrigation pipes. The study involved a total of 48 pipes; 24 pipes were randomly selected from each of the company’s two manufacturing plants. The pipes were heat-treated at one one of four temperatures (175, 200, 225, 250°F). The pipes were chemically treated with one of three types of hardeners (H1, H2, H3). The deviations from the nominal compressive strength were measured at five locations on each of the pipes.
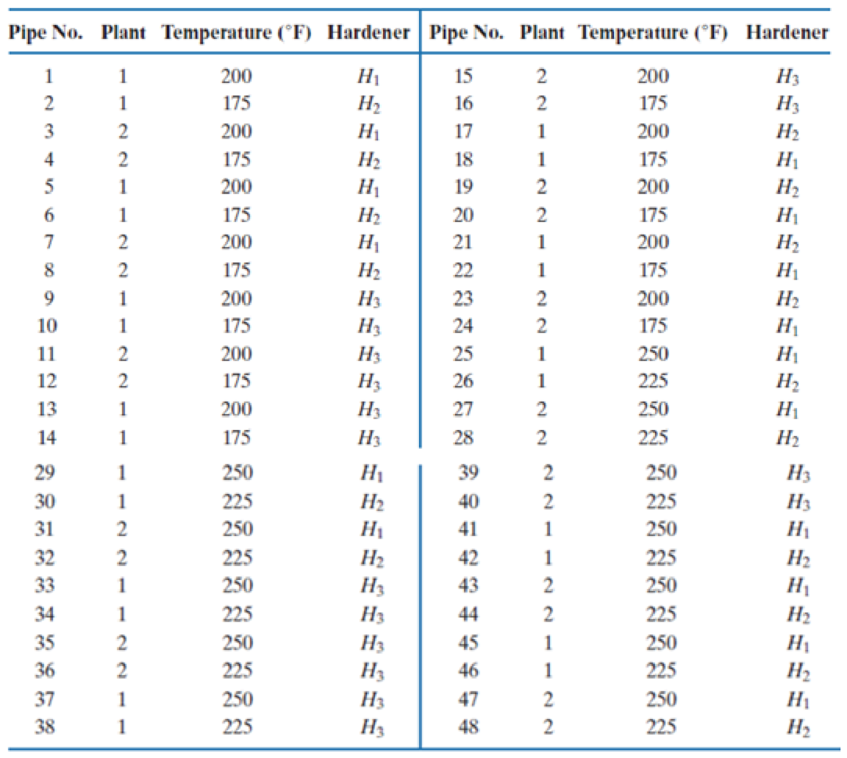
Identify each of the following components of the experimental design.
- a. Factors
- b. Factor levels
- c. Blocks
- d. Experimental unit
- e. Measurement unit
- f. Replications
- g.
Covariates - h. Treatments
Want to see the full answer?
Check out a sample textbook solution
Chapter 2 Solutions
An Introduction to Statistical Methods and Data Analysis


- A paper investigated the driving behavior of teenagers by observing their vehicles as they left a high school parking lot and then again at a site approximately 1 2 mile from the school. Assume that it is reasonable to regard the teen drivers in this study as representative of the population of teen drivers. MaleDriver FemaleDriver 1.4 -0.2 1.2 0.5 0.9 1.1 2.1 0.7 0.7 1.1 1.3 1.2 3 0.1 1.3 0.9 0.6 0.5 2.1 0.5 (a) Use a .01 level of significance for any hypothesis tests. Data consistent with summary quantities appearing in the paper are given in the table. The measurements represent the difference between the observed vehicle speed and the posted speed limit (in miles per hour) for a sample of male teenage drivers and a sample of female teenage drivers. (Use ?males − ?females. Round your test statistic to two decimal places. Round your degrees of freedom down to the nearest whole number. Round your p-value to three decimal places.) t = df =…arrow_forward6. In the book Business Research Methods (5th ed.), Donald R. Cooper and C. William Emory discuss studying the relationship between on-the-job accidents and smoking. Cooper and Emory describe the study as follows: Suppose a manager implementing a smoke-free workplace policy is interested in whether smoking affects worker accidents. Since the company has complete reports of on-the-job accidents, she draws a sample of names of workers who were involved in accidents during the last year. A similar sample from among workers who had no reported accidents in the last year is drawn. She interviews members of both groups to determine if they are smokers or not. The sample results are given in the following table.arrow_forwardA local church is interested in determining how length of residence in the present community relates to church attendance. Using a random sample of 15 individuals, they gathered data on how many times in the previous 5 weeks each individual attended church services. The data are provided below. Length of residence in the community Less than 2 years 2-5 years More than 5 years 0 0 1 1 2 3 3 3 3 4 4 4 4 5 4 Using the 5-step model, determine whether and how church attendance is related to length of residence in the community. Use 5% and 1% levels of statistical significance. What are the assumptions for this problem?arrow_forward
- In a study of exhaust emissions from school buses, the pollution intake by passengers was determined for a sample of nine school buses used in the Southern California Air Basin. The pollution intake is the amount of exhaust emissions, in grams per person per million grams emitted, that would be inhaled while traveling on the bus during its usual 18-mile18-mile trip on congested freeways from South Central LA to a magnet school in West LA. (In comparison, a city of 11 million people will inhale a total of about 1212 grams of exhaust per million grams emitted.) The amounts for the nine buses when driven with the windows open are given in the table. 1.15 0.33 0.40 0.33 1.35 0.38 0.25 0.40 0.35 A good way to judge the effect of outliers is to do your analysis twice, once with the outliers and a second time without them. Give the 90%90% confidence interval with all the data for the mean pollution intake among all school buses used in the Southern California Air Basin that…arrow_forwardA doctor would like to evaluate whether flu-frequency is different among patients of various ages. He groups his most recent 12 patients into four groups according to age (pediatric, young adult, older adult, senior), and counts the frequency of their flu-related visits. Below is his data. Test the hypothesis that flu frequency is different among pediatric, adult, older adult, and senior patients using an alpha level of .01. Pediatric. Young Adult. Older Adult. Senior 6 2 4 7 4 1 0 9 5 0 0 12 d. Find the critical value: e. Calculate the obtained statistic: f. Make a decision: g. What does your decision mean? h.…arrow_forwardThe following data represents results from an experiment comparing 3 treatment conditions for the cure of boredom. Treatment 1 is doing schoolwork, Treatment 2 is watching tv, and Treatment 3 is spending time with friends. The following scores represent treatment effectiveness scores where higher values indicate that the treatment of boredom was effective and lower values indicate that the treatment of boredom was ineffective. Treatment 1 Treatment 2 Treatment 3 0 1 6 N= 12 1 4 5 GM= 3.00 0 1 8 3 2 5…arrow_forward
- A doctor would like to evaluate whether flu-frequency is different among patients of various ages. He groups his most recent 12 patients into four groups according to age (pediatric, young adult, older adult, senior), and counts the frequency of their flu-related visits. Below is his data. Test the hypothesis that flu frequency is different among pediatric, adult, older adult, and senior patients using an alpha level of .01. Pediatric. Young Adult. Older Adult. Senior 6 2 4 7 4 1 0 9 5 0 0 12 g. What does your decision mean? h. Paste your SPSS output here: i. Explain how the Sig. value in your SPSS output leads you to…arrow_forward1. In the book Design and Analysis of Experiments, 8th edition (2012, John Wiley & Sons), the results of an experiment involving a storage battery used in the launching mechanism of a shoulder-fired ground-to-air missile were presented. Three material types can be used to make the battery plates. The objective is to design a battery that is relatively unaffected by the ambient temperature. The output response from the battery is effective life in hours. Three temperature levels are selected, and a factorial experiment with four replicates is run. The data are as follows: Table 11.(a) Test the appropriate hypotheses and draw conclusions using the analysis ether either firing temperature or furnace position affects the baked density of a carbon anode. The data are as follows: Table 12.(a) State the hypotheses of interest. (b) Test the hypotheses in part (a) using the analysis of variance with a = 0.05. What are your conclusions? (c) Analyze the residuals from this experiment. (d)…arrow_forwardIn a study of a group of women science majors who remained in their profession and a group who left their profession within a few months of graduation, the researchers collected the data shown here on a self-esteem questionnaire. Leavers Stayers1 = 3.05 2 = 2.92σ1 = 0.71 σ2 = 0.71n1 = 100 n2 = 227At α = 0.05, can it be concluded that there is a difference in the self-esteem scores of the two groups? Use the P-value method.arrow_forward
- Chapter 6, Section 5, Exercise 236 Use a t-distribution and the given matched pair sample results to complete the test of the given hypotheses. Assume the results come from random samples, and if the sample sizes are small, assume the underlying distribution of the differences is relatively normal. Assume that differences are computed using d=x1-x2.Test H0 : μd=0 vs Ha : μd≠0 using the paired difference sample results x¯d=10.51, sd=11.6, nd=25. Give the test statistic and the p-value.Round your answer for the test statistic to two decimal places and your answer for the p-value to three decimal places.test statistic = Enter your answer; test statisticp-value = Enter your answer; p-value Give the conclusion using a 5% significance level. Reject H0. Do not reject H0.arrow_forwardA doctor would like to evaluate whether flu-frequency is different among patients of various ages. He groups his most recent 12 patients into four groups according to age (pediatric, young adult, older adult, senior), and counts the frequency of their flu-related visits. Below is his data. Test the hypothesis that flu frequency is different among pediatric, adult, older adult, and senior patients using an alpha level of .01. Pediatric. Young Adult. Older Adult. Senior 6 2 4 7 4 1 0 9 5 0 0 12 a. What test is appropriate? b. State your null hypothesis: c. State your alternative hypothesis. d. Find the critical value:…arrow_forwardAn industrial-organizational psychologist believes that implementing a 2-hour lunch break at US companies will have an effect on employee productivity. On a productivity scale from 1 to 15, the average productivity score for all companies in the US is 8 (u = 8.00, ỡ = 4.00). The IO psychologist randomly samples 5 companies and has the companies implement a 2-hour lunch break for 1 month. At the end of the month, the lO psychologist measures the productivity scores for the five companies and obtains the following scores: 9, 14, 10, 12, 15 Using the appropriate hypothesis test and the six steps of hypothesis testing, determine what the 10 psychologist should conclude about the effect of a 2-hour lunch break on employee productivity. 1) What are the null and alternative hypotheses 2)Construct a sampling distribution of means representing the null hypothesis. Specify the sampling distribution's mean and standard error 3)Using a two-tailed alpha of .05 (a = 05), determine the critical…arrow_forward
 MATLAB: An Introduction with ApplicationsStatisticsISBN:9781119256830Author:Amos GilatPublisher:John Wiley & Sons Inc
 Probability and Statistics for Engineering and th...StatisticsISBN:9781305251809Author:Jay L. DevorePublisher:Cengage Learning
 Statistics for The Behavioral Sciences (MindTap C...StatisticsISBN:9781305504912Author:Frederick J Gravetter, Larry B. WallnauPublisher:Cengage Learning
 Elementary Statistics: Picturing the World (7th E...StatisticsISBN:9780134683416Author:Ron Larson, Betsy FarberPublisher:PEARSON
 The Basic Practice of StatisticsStatisticsISBN:9781319042578Author:David S. Moore, William I. Notz, Michael A. FlignerPublisher:W. H. Freeman
 Introduction to the Practice of StatisticsStatisticsISBN:9781319013387Author:David S. Moore, George P. McCabe, Bruce A. CraigPublisher:W. H. Freeman