
An Introduction to Statistical Methods and Data Analysis
7th Edition
ISBN: 9781305269477
Author: R. Lyman Ott, Micheal T. Longnecker
Publisher: Cengage Learning
expand_more
expand_more
format_list_bulleted
Videos
Textbook Question
Chapter 2.8, Problem 14E
The process engineer designed a study to evaluate the quality of plastic irrigation pipes. The study involved a total of 48 pipes; 24 pipes were randomly selected from each of the company’s two manufacturing plants. The pipes were heat-treated at one one of four temperatures (175, 200, 225, 250°F). The pipes were chemically treated with one of three types of hardeners (H1, H2, H3). The deviations from the nominal compressive strength were measured at five locations on each of the pipes.
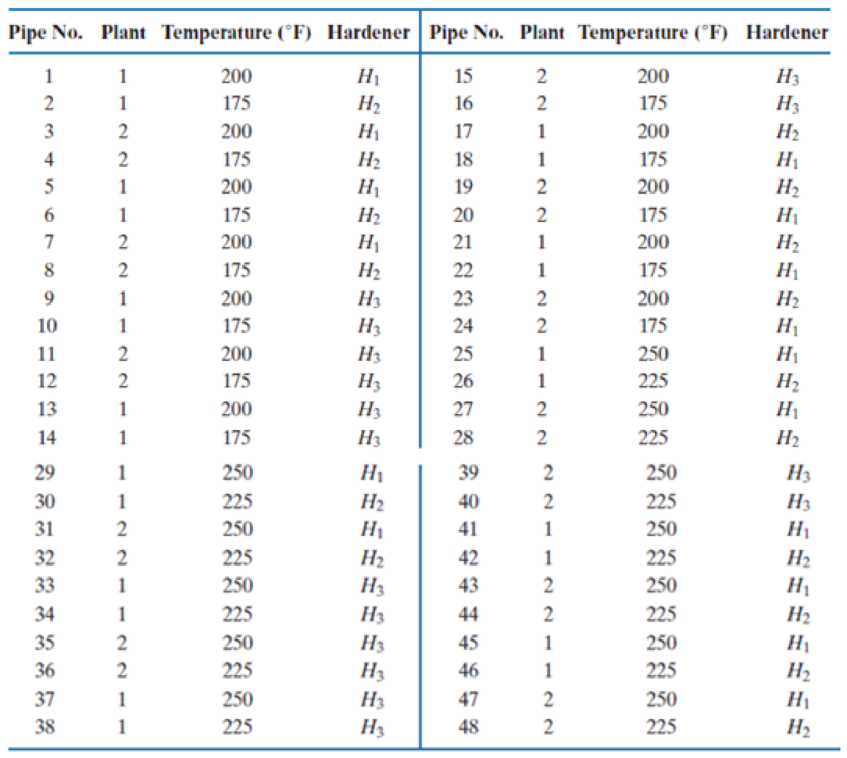
Identify each of the following components of the experimental design.
- a. Factors
- b. Factor levels
- c. Blocks
- d. Experimental unit
- e. Measurement unit
- f. Replications
- g.
Covariates - h. Treatments
Expert Solution & Answer
Want to see the full answer?
Check out a sample textbook solution
Students have asked these similar questions
Suppose that samples of polythene bags from two manufacturers A and B are tested by a prospective buyer for bursting pressure, with the following results:
If the prices are the same, which manufacture’s bags would be preferred by the buyer? Why?
An experiment to determine the effect of four different types of engine oil (A, B, C, and D) on the rolling friction coefficient of a car speed has been conducted. Three brands of car (Honda, Toyota, and Mazda) were chosen, and each engine oil was tested twice on each car, producing the following ANOVA output in Figure 2.
i) How many treatments involved? Write down all the treatments
ii) Identify the number of replication for each treatment.
iii) Based on the ANOVA table above, find the values of W, X, Y and Z.
iv) Test the interaction effect on rolling friction coefficient of car speed between the four different types of engine oil and the three different brands of car.
v) Do we need to test for marginal effect? Give a reason.
Q1 A) List down the measures of central tendency and measures of dispersion 2) The operations manager of a plant that manufactures tires wants to compare the actual inner diameters of two grades of tires, each of
B) which is expected to be 575 millimeters. A sample of five tires of each grade was selected, and the results representing the inner diameters of the tires, ranked from smallest to largest, are as follows.
Grade X
grade Y
568 570 575 578 584
573 574 575 577 578
requirement.
a) for each of the tow grades of tries, compute the mwan, median, and standred deviation.
b) which grade of tire providing better quality? explain.
c) what would be the effect on your answer in (a) and (b) if the last value for grade Y were 588 insert 578 explain.
C) The file contins the overall miles per gallon (MPG) OF 2010 family sedan:
24 21 22 23 24 34 34 34 20 20 22 22 44 32 20 20 22 20 39 20
Source:…
Chapter 2 Solutions
An Introduction to Statistical Methods and Data Analysis
Ch. 2.8 - In the following descriptions of a study,...Ch. 2.8 - In the following descriptions of a study,...Ch. 2.8 - A news report states that minority children who...Ch. 2.8 - A study was conducted to determine if the...Ch. 2.8 - Prob. 5ECh. 2.8 - A large auto parts supplier with distribution...Ch. 2.8 - The circuit judges in a rural county are...Ch. 2.8 - Prob. 8ECh. 2.8 - Time magazine, in an article in the late 1950s,...Ch. 2.8 - The New York City school district is planning a...
Ch. 2.8 - A professional society, with a membership of...Ch. 2.8 - For each of the following situations, decide what...Ch. 2.8 - For each of the following situations, decide what...Ch. 2.8 - The process engineer designed a study to evaluate...Ch. 2.8 - Prob. 15ECh. 2.8 - In the descriptions of experiments given in...Ch. 2.8 - In the descriptions of experiments given in...Ch. 2.8 - In the descriptions of experiments given in...Ch. 2.8 - A research specialist for a large seafood company...Ch. 2.8 - In Exercises 2.20–2.22, identify whether the...Ch. 2.8 - In Exercises 2.202.22, identify whether the design...Ch. 2.8 - In Exercises 2.20–2.22, identify whether the...Ch. 2.8 - A bakery wants to evaluate new recipes for carrot...Ch. 2.8 - Prob. 24SECh. 2.8 - Prob. 25SECh. 2.8 - Prob. 26SECh. 2.8 - Prob. 27SECh. 2.8 - Prob. 28SECh. 2.8 - Prob. 29SECh. 2.8 - A forester wants to estimate the total number of...Ch. 2.8 - A transportation researcher is funded to estimate...Ch. 2.8 - The department of agriculture in a midwestern...Ch. 2.8 - Prob. 33SECh. 2.8 - A Yankelovich, Skelly, and White poll taken in the...
Knowledge Booster


Learn more about
Need a deep-dive on the concept behind this application? Look no further. Learn more about this topic, statistics and related others by exploring similar questions and additional content below.Similar questions
- In a survey of 180 females who recently completed high school, 75% were enrolled in college. In a survey of 160 males who recently completed high school, 70% were enrolled in college. At α=0.07, can you reject the claim that there is no difference in the proportion of college enrollees between the two groups? Assume the random samples are independent. Complete parts (a) through (e). Find the critical value(s) and identify the rejection region(s).arrow_forwardA student makes ten measurements of the density of a gas (g/L) at a reduced pressure of 10.00 kPa and obtains the following values: 0.189, 0.167, 0.187, 0.183, 0.186, 0.182, 0.181, 0.184, 0.181, 0.177 From the list of values above, the most likely candidate is .... Based on a standard Q test, the calculated Q value for this entry is.......arrow_forwardCalculate the average values of the Cp and Cpk capabil-ity indices for the BOD data , assuming that LSL=5 mg/L and USL=35 mg/L. Do these val-ues of the indices indicate that the process performance is satisfactory?arrow_forward
- The aging Neotropical termites (Neocapritermes taracua) secrete a sticky, blue-colored liquid that they spew to intruding termites. The younger Neotropical termites secrete a liquid that lacks the blue component, so it is white in appearance. In an experiment that measured the toxicity of the blue substance, the researchers placed one drop of either the blue liquid or the white liquid on individuals of a second termite species, Labiotermes labralis. Of the 41 Labiotermes labralis that got the blue drop, 37 were immobilized. Of the 40 Labiotermes labralis that got the white drop, 9 were immobilized. Is the blue liquid toxic compared to the white liquid?arrow_forwardAn article in Knee Surgery, Sports Traumatology, Arthroscopy (2005, Vol. 13, pp. 273-279) considered arthroscopic meniscal repair with an absorbable screw. Results showed that for tears greater than 25 millimeters, 14 of 18 (78%) repairs were successful, but for shorter tears, 22 of 30 (73%) repairs were successful. A doctor would like to know if there is evidence that the success rate is greater for longer tears. The P-value for the test H0: p1 = p2 versus H1: p1 > p2 is closest to:arrow_forwardThe average weight of a Coastal male Grizzly Bear is approximately normal with E(x); =795 pounds and SD * (x) = 80 pounds. 8. How likely is it to randomly select 64 Coastal male Grizzly Bears with a sample average weight of 810 pounds or more? Which density curve is the best model for this problem?arrow_forward
- A survey of 90 recently delivered women on the rolls of a county welfare department revealed that 27 had a history of intrapartum or postpartum infection. What is the critical value of z if we need to conclude that the population proportion with a history of intrapartum or postpartum infection is less than 0.25.arrow_forwardCalculate the t-test statistic using the standard error from part a. t= At α=0.02 , Use the distribution table to find the critical values for the rejection regiontc=±____arrow_forwardResearchers interested in lead exposure due to car exhaust sampled the blood of 52 police officers subjected to constant inhalation of automobile exhaust fumes while working traffic enforcement in a primarily urban environment. The blood samples of these officers had an average lead concentration of 124.32 µg/l and a SD of 37.74 µg/l; a previous study of individuals from a nearby suburb, with no history of exposure, found an average blood level concentration of 35 µg/l. Test the hypothesis that the downtown police officers have a higher lead exposure than the group in the previous study. Interpret your results in context. Based on your preceding result, without performing a calculation, would a 99% confidence interval for the average blood concentration level of police officers contain 35 µg/l? Based on your preceding result, without performing a calculation, would a 99% confidence interval for this difference contain 0? Explain why or why not.arrow_forward
- A researcher did a one-tailed one-sample t-test to test the hypothesis that babies prefer the color blue over the color red. He collected a sample of 26 babies and presented them with a red plastic star and a blue plastic start for 12 seconds. The researcher measured the amount of time each baby spent watching the blue star out of the 12 seconds. What is the critical t value, assuming the alpha level used was .05?arrow_forwardWhat is the difference between the critical value of z and the observed value of z?arrow_forwardDetermine the kurtosis if the data given is a sample.arrow_forward
arrow_back_ios
SEE MORE QUESTIONS
arrow_forward_ios
Recommended textbooks for you
 MATLAB: An Introduction with ApplicationsStatisticsISBN:9781119256830Author:Amos GilatPublisher:John Wiley & Sons Inc
 Probability and Statistics for Engineering and th...StatisticsISBN:9781305251809Author:Jay L. DevorePublisher:Cengage Learning
 Statistics for The Behavioral Sciences (MindTap C...StatisticsISBN:9781305504912Author:Frederick J Gravetter, Larry B. WallnauPublisher:Cengage Learning
 Elementary Statistics: Picturing the World (7th E...StatisticsISBN:9780134683416Author:Ron Larson, Betsy FarberPublisher:PEARSON
 The Basic Practice of StatisticsStatisticsISBN:9781319042578Author:David S. Moore, William I. Notz, Michael A. FlignerPublisher:W. H. Freeman
 Introduction to the Practice of StatisticsStatisticsISBN:9781319013387Author:David S. Moore, George P. McCabe, Bruce A. CraigPublisher:W. H. Freeman
MATLAB: An Introduction with Applications
Statistics
ISBN:9781119256830
Author:Amos Gilat
Publisher:John Wiley & Sons Inc
Probability and Statistics for Engineering and th...
Statistics
ISBN:9781305251809
Author:Jay L. Devore
Publisher:Cengage Learning
Statistics for The Behavioral Sciences (MindTap C...
Statistics
ISBN:9781305504912
Author:Frederick J Gravetter, Larry B. Wallnau
Publisher:Cengage Learning
Elementary Statistics: Picturing the World (7th E...
Statistics
ISBN:9780134683416
Author:Ron Larson, Betsy Farber
Publisher:PEARSON
The Basic Practice of Statistics
Statistics
ISBN:9781319042578
Author:David S. Moore, William I. Notz, Michael A. Fligner
Publisher:W. H. Freeman
Introduction to the Practice of Statistics
Statistics
ISBN:9781319013387
Author:David S. Moore, George P. McCabe, Bruce A. Craig
Publisher:W. H. Freeman
Hypothesis Testing using Confidence Interval Approach; Author: BUM2413 Applied Statistics UMP;https://www.youtube.com/watch?v=Hq1l3e9pLyY;License: Standard YouTube License, CC-BY
Hypothesis Testing - Difference of Two Means - Student's -Distribution & Normal Distribution; Author: The Organic Chemistry Tutor;https://www.youtube.com/watch?v=UcZwyzwWU7o;License: Standard Youtube License