
Videos
(a)
To graph: The given data.
(a)
Explanation of Solution
Given information:
Data of year v/s stock
Graph:
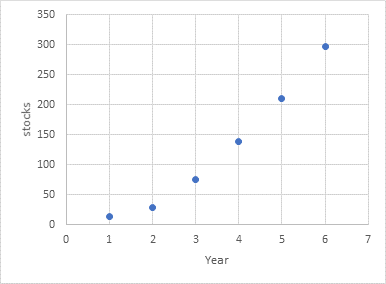
Where, 1 represents year 2011.
Interpretation: It is a increasing graph
(b)
To find: quadratic model of the graph.
(b)
Answer to Problem 18E
Equation is
Explanation of Solution
Given information:
Data of the year v/s stock.
Calculation: As the
For x = 1 and f(x) = 13.52
Equation is
(c)
To find: The linear model of graph
(c)
Answer to Problem 18E
The linear model of graph is
Explanation of Solution
Given information:
Graph of the year v/s stocks.
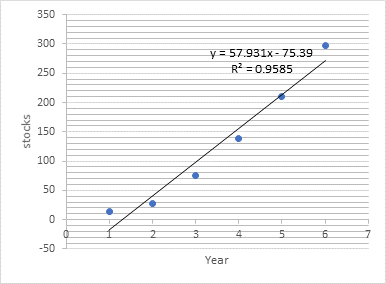
By graphing utility the linear model of graph is
(d)
To estimate: The year in which battery stock will be 530,000
(d)
Answer to Problem 18E
The year is 2021. As the linear model is not a good fit so it can`t be estimate.
Explanation of Solution
Given information:
Battery stock will be 530,000
So the year is 2021
As the linear model is not a good fit so it can`t be estimate.
Chapter 2 Solutions
PRECALCULUS W/LIMITS:GRAPH.APPROACH(HS)


 Calculus: Early TranscendentalsCalculusISBN:9781285741550Author:James StewartPublisher:Cengage Learning
 Thomas' Calculus (14th Edition)CalculusISBN:9780134438986Author:Joel R. Hass, Christopher E. Heil, Maurice D. WeirPublisher:PEARSON
 Calculus: Early Transcendentals (3rd Edition)CalculusISBN:9780134763644Author:William L. Briggs, Lyle Cochran, Bernard Gillett, Eric SchulzPublisher:PEARSON
 Calculus: Early TranscendentalsCalculusISBN:9781319050740Author:Jon Rogawski, Colin Adams, Robert FranzosaPublisher:W. H. Freeman
 Calculus: Early Transcendental FunctionsCalculusISBN:9781337552516Author:Ron Larson, Bruce H. EdwardsPublisher:Cengage Learning