
Operations Management: Processes and Supply Chains (12th Edition) (What's New in Operations Management)
12th Edition
ISBN: 9780134741062
Author: Lee J. Krajewski, Manoj K. Malhotra, Larry P. Ritzman
Publisher: PEARSON
expand_more
expand_more
format_list_bulleted
Concept explainers
Question
Chapter 3, Problem 1P
Summary Introduction
To calculate:
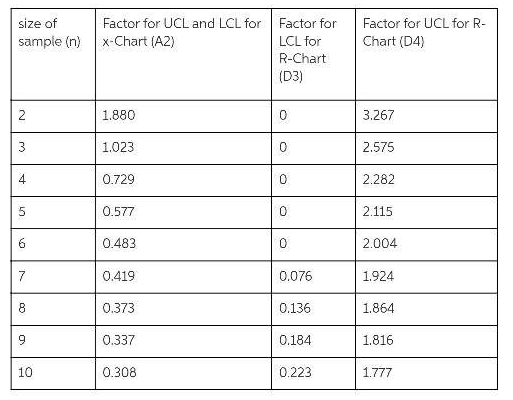
Use the table below,establish control limits for sample mean and ranges for the car wash process.
Expert Solution & Answer
Want to see the full answer?
Check out a sample textbook solution
Students have asked these similar questions
At Quick Car Wash, the wash process is advertised to take less than 6 minutes. Consequently, management has set a target average of 320 seconds for the wash process. Suppose the average range for a sample of 10 cars is 10 seconds. Use the accompanying table to establish control limits for sample means and ranges for the car wash process.
At Quick Car Wash, the wash process is advertised to take less than 7 minutes. Consequently, management has set a target average of 390 seconds for the wash process. Suppose the average range for a sample of 10 cars is 11 seconds. Use the accompanying table to establish control limits for sample means and ranges for the car wash process.
The
UCL Subscript x overbar equals seconds and the LCL Subscript x overbar equals seconds. (Enter your responses rounded to two decimal places.)
At Quick Car Wash, the wash process is advertised to take less than 7 minutes. Consequently, management has set a target average of 390 seconds for the wash process. Suppose the average range for a sample of 10 cars is 11 seconds.
Part 2
The
UCL Subscript Upper R equals seconds and the LCL Subscript Upper R equals seconds. (Enter your responses rounded to two decimal places.)
Chapter 3 Solutions
Operations Management: Processes and Supply Chains (12th Edition) (What's New in Operations Management)
Ch. 3 - Should a very pricey handcrafted object of beauty...Ch. 3 - Prob. 2DQCh. 3 - Prob. 3DQCh. 3 - Prob. 1PCh. 3 - Prob. 2PCh. 3 - Prob. 3PCh. 3 - Prob. 4PCh. 3 - Prob. 5PCh. 3 - Prob. 6PCh. 3 - Prob. 7P
Ch. 3 - Prob. 8PCh. 3 - Prob. 9PCh. 3 - Prob. 10PCh. 3 - Prob. 11PCh. 3 - Prob. 12PCh. 3 - Prob. 13PCh. 3 - Prob. 14PCh. 3 - Prob. 15PCh. 3 - Prob. 16PCh. 3 - Prob. 17PCh. 3 - Prob. 18PCh. 3 - Prob. 19PCh. 3 - Prob. 20PCh. 3 - Prob. 21PCh. 3 - Prob. 26PCh. 3 - Prob. 27PCh. 3 - Prob. 28PCh. 3 - Prob. 29PCh. 3 - Prob. 31PCh. 3 - Prob. 1AMECh. 3 - Prob. 2AMECh. 3 - Prob. 3AMECh. 3 - Prob. 4AMECh. 3 - Prob. 5AMECh. 3 - Prob. 1VCCh. 3 - Prob. 2VC
Knowledge Booster


Learn more about
Need a deep-dive on the concept behind this application? Look no further. Learn more about this topic, operations-management and related others by exploring similar questions and additional content below.Similar questions
- At Quick Car Wash, the wash process is advertised to take less than 7 minutes. Consequently, management has set a target average of 390 seconds for the wash process. Suppose the average range for a sample of 9 cars is 8 seconds. Use the accompanying table to establish control limits for sample means and ranges for the car wash process. LOADING... Click the icon to view the table of factors for calculating three-sigma limits for the x overbarx-chart and R-chart. Factors for calculating three-sigma limits for the x overbarx-chart and R-chart Size of Sample (n) Factor for UCL and LCL for x overbarx-chart (Upper A 2A2) Factor for LCL for R-Chart (Upper D 3D3) Factor for UCL for R-Chart (Upper D 4D4) 2 1.8801.880 00 3.2673.267 3 1.0231.023 00 2.5752.575 4 0.7290.729 00 2.2822.282 5 0.5770.577 00 2.1152.115 6 0.4830.483 00 2.0042.004 7 0.4190.419 0.0760.076 1.9241.924 8 0.3730.373…arrow_forwardAt Quick Car Wash, the wash process is advertised to take less than 7 minutes. Consequently, management has set a target average of 390 seconds for the wash process. Suppose the average range for a sample of 9 cars is 8 seconds. Use the accompanying table to establish control limits for sample means and ranges for the car wash process. LOADING... Click the icon to view the table of factors for calculating three-sigma limits for the x overbarx-chart and R-chart. Factors for calculating three-sigma limits for the x overbarx-chart and R-chart Size of Sample (n) Factor for UCL and LCL for x overbarx-chart (Upper A 2A2) Factor for LCL for R-Chart (Upper D 3D3) Factor for UCL for R-Chart (Upper D 4D4) 2 1.8801.880 00 3.2673.267 3 1.0231.023 00 2.5752.575 4 0.7290.729 00 2.2822.282 5 0.5770.577 00 2.1152.115 6 0.4830.483 00 2.0042.004 7 0.4190.419 0.0760.076 1.9241.924 8 0.3730.373…arrow_forwardYou pull 5 bags of chips off of the production line every hour. The process is currently under control. The average weights are calculated for each sample, and the average of those averages is 129.1. The ranges are calculated for each sample, and the average of those ranges is 4.1. What is the Upper Control Limit for the X-bar chart? Round your answer to one decimal place.arrow_forward
- What is the significance of the order of observation in process control?arrow_forwardWhy are most processes not in statistical control when they are first sampled for control chart purposes? *250 words minimum. Thank you!arrow_forwardSam’s Long Life 60-watt light bulbs are designed to have a life of 1,350 hours with tolerance of ± 340 hours. A recent representative sample from the process that makes these light bulbs revealed a mean of 1,290 hours, with a standard deviation of 94 hours. Compute a. Compute the process capability ratio and the process capability index, and comment on the overall capability of the process b. Explain to what extent the process for producing Sam’s Long Life 60-watt light bulbs would have to be improved to achieve 4-sigma quality. c. show detail workarrow_forward
- What is it important to prove that a process is proven capable before developing statistical control limit ?arrow_forwardOne of the stages in the process of making denim cloth at the Southern Mills Company is to spin cotton yarn onto spindles for subsequent use in the weaving process. Occasionally the yarn breaks during the spinning process, and an operator ties it back together. Some number of breaks is considered normal; however, too many breaks may mean that the yarn is of poor quality. In order to monitor this process, the quality-control manager randomly selects a spinning machine each hour and checks the number of breaks during a 15-minute period. Following is a summary of the observations for the past 20 hours. Construct a c-chart using 3 limits for this process and indicate if the process was out of control at any time.arrow_forwardWhen plotting a process, with the intention of monitoring trends, which of the following apply? Select one: a. An increase in the mean and a decrease in variation is desirable b. A decrease in both the mean and variation is desirable c. The optimum mean may be lower or higher than current values d. The mean is not as important as the variationarrow_forward
- The Watson Electric Company produces incandescent light bulbs. The following data on the number of lumens for 40-watt light bulbs were collected when the process was in control. The standard deviation of the process is 15. Calculate control limits for an x-bar chart with 3-sigma limit and draw the chart. Since these data were collected, some new employees were hired. A new sample obtained the following readings: 625, 592, 612, and 650. Is the process still in control?arrow_forwardArham is the head of production department in a pharmaceutical company. He has given a target about the number of tablets that will be produced per month. He has also assigned total number of workers and hours to achieve the desired objective. This situation represents which step in control process Select one: a. Measuring performance b. None of these c. Comparison of actual with standards d. Taking corrective actionarrow_forwardUsing the proper control chart, determine two-sigma control limits for the situation below. a. An examiner found an average of 4.9 scratches in the outer paint of each of the vehicles being made for delivery to dealers. b. Before delivery of lawn mowers to dealers, an examiner tries to start each mower and notes any that do not start on the first try. The lot size is 200 mowers, and an average of 5 did not start (2.5 percent)arrow_forward
arrow_back_ios
SEE MORE QUESTIONS
arrow_forward_ios
Recommended textbooks for you
 Practical Management ScienceOperations ManagementISBN:9781337406659Author:WINSTON, Wayne L.Publisher:Cengage,
 Operations ManagementOperations ManagementISBN:9781259667473Author:William J StevensonPublisher:McGraw-Hill Education
 Operations and Supply Chain Management (Mcgraw-hi...Operations ManagementISBN:9781259666100Author:F. Robert Jacobs, Richard B ChasePublisher:McGraw-Hill Education
 Purchasing and Supply Chain ManagementOperations ManagementISBN:9781285869681Author:Robert M. Monczka, Robert B. Handfield, Larry C. Giunipero, James L. PattersonPublisher:Cengage Learning
 Production and Operations Analysis, Seventh Editi...Operations ManagementISBN:9781478623069Author:Steven Nahmias, Tava Lennon OlsenPublisher:Waveland Press, Inc.
Practical Management Science
Operations Management
ISBN:9781337406659
Author:WINSTON, Wayne L.
Publisher:Cengage,
Operations Management
Operations Management
ISBN:9781259667473
Author:William J Stevenson
Publisher:McGraw-Hill Education
Operations and Supply Chain Management (Mcgraw-hi...
Operations Management
ISBN:9781259666100
Author:F. Robert Jacobs, Richard B Chase
Publisher:McGraw-Hill Education
Purchasing and Supply Chain Management
Operations Management
ISBN:9781285869681
Author:Robert M. Monczka, Robert B. Handfield, Larry C. Giunipero, James L. Patterson
Publisher:Cengage Learning
Production and Operations Analysis, Seventh Editi...
Operations Management
ISBN:9781478623069
Author:Steven Nahmias, Tava Lennon Olsen
Publisher:Waveland Press, Inc.