
Concept explainers
Videos
The estimated times and immediate predecessors for the activities in a project at George Kyparis’s retinal scanning company are given in the following table. Assume that the activity times are independent.
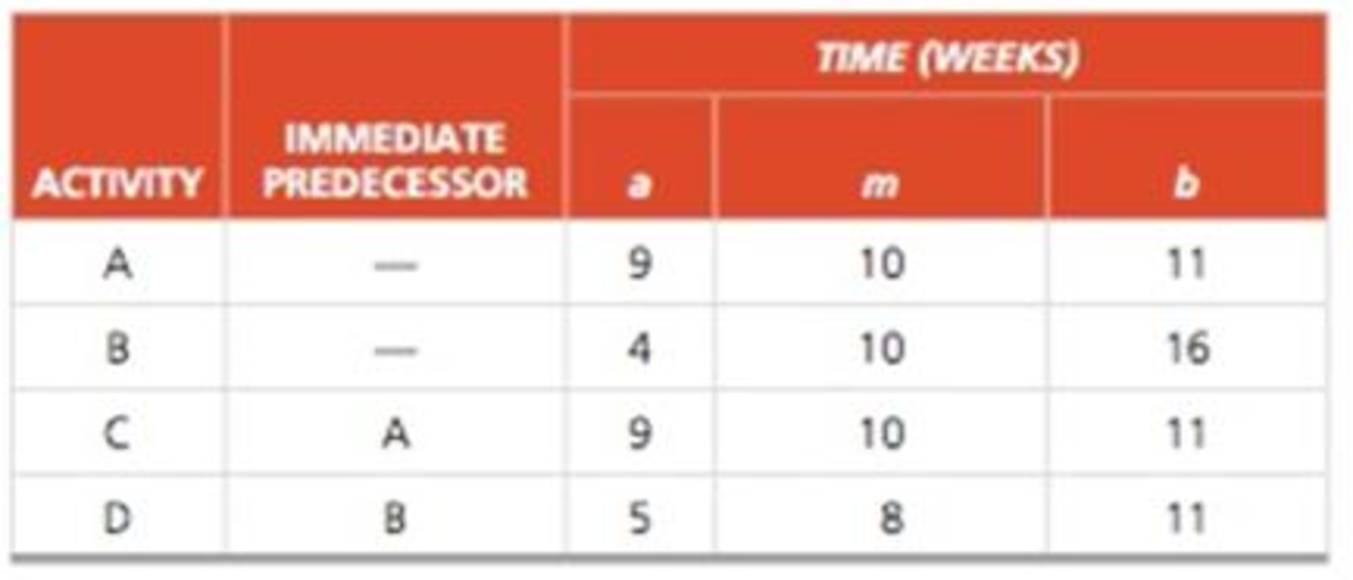
a) Calculate the expected time and variance for each activity.
b) What is the expected completion time of the critical path? What is the expected completion time of the other path in the network?
c) What is the variance of the critical path? What is the variance of the other path in the network?
d) If the time to complete path A–C is
e) If the time to complete path B–D is normally distributed, what is the probability that this path will be finished in 22 weeks or less?
f) Explain why the probability that the critical path will be finished in 22 weeks or less is not necessarily the probability that the project will be finished in 22 weeks or less.
a)
To determine: The expected time and variance.
Introduction:
The activity times of various tasks in a PERT project network are assumed to follow a probability distribution. For calculating the expected times and standard deviation, the parameters required are the following:
- Optimistic time: This is the time denoted by “a”, which is the best possible or in other words, the quickest time in which an activity can be completed, assuming that everything goes as per plan.
- Pessimistic time: This is the worst case scenario, where all the conditions are adverse or unfavorable. The maximum time which may be taken in such a situation is the pessimistic time denoted by “b”.
- Most likely time: The most realistic estimate of the time, denoted by “m” in normal conditions, is another parameter which is important in the computation of expected times and variances.
Answer to Problem 20P
The expected times and varianceare shown in Table 1.
Explanation of Solution
Given information:
| Activity | Immediate predecessor | Time in weeks | ||
| a | m | b | ||
| A | 9 | 10 | 11 | |
| B | 4 | 10 | 16 | |
| C | A | 9 | 10 | 11 |
| D | B | 5 | 8 | 11 |
Formula:
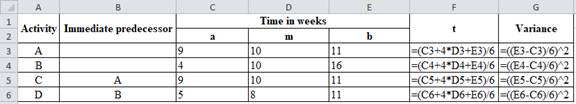
Calculate the expected time t and the variances for each activity by using the equations
where ‘a’ is the optimistic time, ‘m’ is the most likely time and ‘b’ is the most pessimistic time.
Calculation of expected time and variance:
The calculations are shown below.
| Activity | Immediate predecessor | Time in weeks | t | Variance | ||
| a | m | b | ||||
| A | 9 | 10 | 11 | 10 | 0.11 | |
| B | 4 | 10 | 16 | 10 | 4 | |
| C | A | 9 | 10 | 11 | 10 | 0.11 |
| D | B | 5 | 8 | 11 | 8 | 1 |
Table 1
Excel worksheet:
Hence, the expected times and variance are shown in Table 1.
b)
To determine: The expected completion of critical path and other path (non-ciritical paths).
Answer to Problem 20P
The critical path is AàC and its expected completion time is 20 weeks. The expected completion time of the other path BàD is 18 weeks.
Explanation of Solution
Given information:
| Activity | Immediate predecessor | Time in weeks | ||
| a | m | b | ||
| A | 9 | 10 | 11 | |
| B | 4 | 10 | 16 | |
| C | A | 9 | 10 | 11 |
| D | B | 5 | 8 | 11 |
Calculation of expected completion of critical path and other path (non-ciritical paths):
AON diagram is constructed which is shown below.
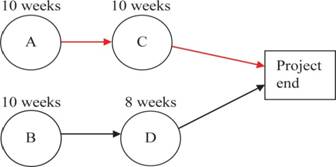
The critical path is AàC and expected completion time is 20 weeks. The expected completion time of the other path BàD is 18 weeks.
Hence, the critical path is AàC and its expected completion time is 20 weeks. The expected completion time of the other path BàD is 18 weeks.
c)
To determine: The variance of critical path and other path (non-ciritical paths).
Answer to Problem 20P
The variance of the critical path AàC is 0.222 weeks and other path BàD is5 weeks.
Explanation of Solution
Given information:
| Activity | Immediate predecessor | Time in weeks | ||
| a | m | b | ||
| A | 9 | 10 | 11 | |
| B | 4 | 10 | 16 | |
| C | A | 9 | 10 | 11 |
| D | B | 5 | 8 | 11 |
Calculation of variance of critical path and other path:
The variance of the critical path AàC is the sum of the variances of activities A and C.
The variance of the critical path is the sum of 0.1111 and 0.1111 (refer table 1) which is 0.2222 weeks.
The variance of the other path BàD is the sum of the variances of activities B and D.
The variance of the other path is the sum of 4 and 1 (refer table 1) which is 5 weeksThe variance of the other path BàD is 5 weeks.
Hence, the variance of the critical path AàC is 0.222 weeks and other path BàD is 5 weeks.
d)
To determine: The probability of finishing the project in 22 weeks, when A-C is normally distributed.
Answer to Problem 20P
Probability of finishing the project in 22 weeks is almost 1.
Explanation of Solution
Given information:
| Activity | Immediate predecessor | Time in weeks | ||
| a | m | b | ||
| A | 9 | 10 | 11 | |
| B | 4 | 10 | 16 | |
| C | A | 9 | 10 | 11 |
| D | B | 5 | 8 | 11 |
Probability of finishing the project in 22 weeks, when A-C is normally distributed:
The expected completion time of critical path AàC is 20 weeks with a variance of 0.22 weeks.
The standard deviation:
The standard deviation is calculated by taking square root of the variance which is 0.22 which yields 0.469.
Z value is calculated by dividing the difference of 22 and 20 with 0.469 which yields 4.264.
Reading from normal distribution tables given the mean is 20 weeks, the variance
Hence, probability of finishing the project in 22 weeks is almost 1.
e)
To determine: The probability of finishing the project in 22 weeks, when B-D is normally distributed.
Answer to Problem 20P
Probability of finishing the project in 22 weeks is 0.963.
Explanation of Solution
Given information:
| Activity | Immediate predecessor | Time in weeks | ||
| a | m | b | ||
| A | 9 | 10 | 11 | |
| B | 4 | 10 | 16 | |
| C | A | 9 | 10 | 11 |
| D | B | 5 | 8 | 11 |
Probability of finishing the project in 22 weeks, when B-D is normally distributed:
The expected completion time of path BàD is 18 weeks with a variance of 5 weeks.
The standard deviation:
The standard deviation is calculated by taking square root of the variance which is 5 which yields 2.236.
Z value is calculated by dividing the difference of 22 and 18 with 2.236 which yields 1.79.
Reading from normal distribution tables given the mean is 18 weeks, the variance
Hence, the probability of finishing the project in 22 weeks is 0.963.
f)
To explain: The reason for the probability that the critical path will be finished in 22 weeks or less is not necessarily the probability that the project will be finished in 22 weeks or less.
Explanation of Solution
Given information:
| Activity | Immediate predecessor | Time in weeks | ||
| a | m | b | ||
| A | 9 | 10 | 11 | |
| B | 4 | 10 | 16 | |
| C | A | 9 | 10 | 11 |
| D | B | 5 | 8 | 11 |
Explanation for the reason for the probability that the critical path will be finished in 22 weeks or less is not necessarily the probability that the project will be finished in 22 weeks or less:
The critical path AàC has a very small variance of only 0.22 weeks compared to the variance along path BàD which is 5 weeks. That is why, despite having lower expected time of completion of 18 weeks, the probability that the path BàD would be completed in 22 weeks is0.963.and is lower than the probability
The project is completed only when all the activities are completed.
Despite the probability of the critical path AàC, being completed in 22 weeks being almost 1, the probability that the project is completed in 22 weeks is0.963.
Want to see more full solutions like this?
Chapter 3 Solutions
PRIN.OF OPERATIONS MANAGEMENT-MYOMLAB


- The fo llowing is a table of activities associated with a project at Rafay lshfaq's software firm in Chicago, their durations, and what activities each must precede: a) Draw an AOA diagram of the project, including activity durations.b) Define the critical path, listing all critical activities in chronological order.c) What is the project completion time (in weeks)?d) What is the slack (in weeks) associated with any and all noncritical paths through the project?arrow_forwardConsider the following PERT time estimates: a. Draw a network for this project and determine the critical path based on the most likely times by inspection.b. Assuming that the critical path is the one you identified in part (a), what is the probability that the project will be completed before 28weeks? Before 32 weeks?c. Assuming that the critical path is the one you identified in part (a), how many weeks are required to complete the project with probability .95?arrow_forwardUse the Program Evaluation and Review Technique to represent the project in an activity network. In conjunction with the Critical Path Method, use the activity network to find the shortest time possible to complete the project, to identify the critical jobs in the project, and to determine the earliest and latest that each activity can start and finish without making the project completion longer.a=1, b=1, c=6, d=5, e=2, f=5; andab=1x1=1, bc=1x6=6, cd=6x5=30, de=5x2=10, ef=2x5=10, af=1x5=5.arrow_forward
- The project detailed in the table below is contracted for delivery in 11 weeks, with a penalty clause requiring the contractor to pay a penalty of $2000 for each week late. The project must therefore be expedited. The possible reductions and associated costs are shown in the table. Times in the table are given in weeks. Only activity 4 can be expedited two weeks. The other activities can be expedited one week. (a) Determine the critical path(s), the expected duration of the project, and the slack time for each activity (indicate value on network)? What is the total project cost with penalty included? (b) How could the project time be reduced to 11 weeks and what is the total project cost? Activity Immediate predecessor Normal time Expedited time Normal cost ($) Expedited cost ($) 1 - 4 3 5,000 6,900 2 - 2 2 3,000 3,000 3 1 5 4 7,000 9,200 4 2 6 4 9,000 11,000 5 2 5 4 6,000 7,800…arrow_forwardGreenzTech Inc. is planning on installing a new computerised accounting system. For thisproject, they have established the following activities, precedence relationships, and timeestimates in weeks:a. Draw the network diagramb. Calculate the expected time for each activity.c. Calculate the variance of each activityd. Based on the calculation of estimated times, what is the critical path?e. What is the estimated time of the critical path?f. What is the activity variance along the critical path?g. What is the probability of completion of the project within 50 weeks or less?arrow_forwardBased on the given set of activities answer the following: 1. Develop a precedence for each of the activity based on the information provided in the case. 2. Draw a network diagram and also calculate the forward and the backward pass for each of the activities. 3. Identify the paths as well as the critical path for the given project and also determine the slack time for each activity. Note: This question is related to Project Management Course.arrow_forward
- Consider a project that has been modeled as in the table below. Part a) Draw the PERT/CPM network for this project and determine the project’s expected completion time μP and its critical path. Part b) Suppose the standard deviations of the activity durations are σA = 2, σB = 1, σC = 0, σD = 2, σE = 3, and σF = 0. Then please estimate the standard deviation of the overall project’s standard deviation σP . Part c) Suppose for the standard Normal random variable Z, we know P[−1 ≤ Z ≤ +1] ' 68%, P[−2 ≤ Z ≤ +2] ' 95%, and P[−3 ≤ Z ≤ +3] ' 99.7%. Then, approximately what time T is one for which there is only a less than 2.5% chance for the completion time to beat (be shorter than)? *Please answer a-c and type your work and answers or write them neatly please* Thank youarrow_forwardConsider a project that has been modeled as in the table below. Part a) Draw the PERT/CPM network for this project and determine the project’s expected completion time μP and its critical path. Part b) Suppose the standard deviations of the activity durations are σA = 2, σB = 1, σC = 0, σD = 2, σE = 3, and σF = 0. Then please estimate the standard deviation of the overall project’s standard deviation σP . Part c) Suppose for the standard Normal random variable Z, we know P[−1 ≤ Z ≤ +1] ' 68%, P[−2 ≤ Z ≤ +2] ' 95%, and P[−3 ≤ Z ≤ +3] ' 99.7%. Then, approximately what time T is one for which there is only a less than 2.5% chance for the completion time to beat (be shorter than)? *Please answer a-c and either type your work and answers or write them neatly showing each step, please* NO EXCEL Thank you!arrow_forwardThe estimated times and immediate predecessors for the activities in a project at Howard Umrah's retinal scanning company are given in the following table. Assume that the activity times are independent. Time (weeks) Immediate Time (weeks) Immediate Activity a m b Predecessor(s) Activity a m b Predecessor(s) A 8 10 13 — C 9 10 13 A B 4 10 16 — D 6 8 12 B This exercise contains only parts a, b, c, and d. a) Based on the activity time estimates, the expected times and variance for each of the activities are (round your response to two decimal places): Activity Expected Time Variance A _________ ___________ B ______________ __________…arrow_forward
- You are provided with the following information for a project, with activity durations given in weeks: Activity Immediate Optimistic Most Likely Pessimistic Predecessor Time (a) Time (m) Time (b) A ____ 2 3 4 B ____ 2 4 6 C A 1 2 3 D B 3 6 9 E C, D 7 8 9 F D 4 7 10 G E 3 4 5 H E, F…arrow_forwardThe following table contains a list of activities, with precedence requirements and crash costs. All start and finish times and crash costs are on a per-week basis. a. Draw the network diagram for the project below. b What is the critical path and completion time for the project? c. Determine the least expensive project cost if the duration is to be 10% shorter than normal project duration. Activity Normal Time Crash Time Normal Cost Crash Cost Predecessor A 10 7 2,000 2,600 B 12 8 1,500 2,000 A C 16 12 2,200 3,000 A D 8 7 2,500 3,000 B E 12 9 1,950 2,275 C F 9 8 800 1,000 D G 24 29 3,650 4,000 E, F H 17 14 1,200 1,800 Garrow_forwardA project has the activity duration and cost information indicated in the table where all times are in weeks. What is the total cost for completing this project in 50 days? Activity Predecessor Normal Time Normal Cost Crash Time Crash Cost A -- 8 $12,000 5 $21,000 B A 12 $20,000 9 $30,000 C A 15 $24,000 10 $60,000 D B 3 $10,000 2 $15,000 E C 9 $17,000 6 $34,000 F E 7 $5,000 6 $6,000 G D 8 $14,000 6 $20,000 H A 12 $22,000 10 $30,000 I H 6 $50,000 5 $55,000 J F, G, I 11 $33,000 9 $50,000arrow_forward
 Practical Management ScienceOperations ManagementISBN:9781337406659Author:WINSTON, Wayne L.Publisher:Cengage,
 Operations ManagementOperations ManagementISBN:9781259667473Author:William J StevensonPublisher:McGraw-Hill Education
 Operations and Supply Chain Management (Mcgraw-hi...Operations ManagementISBN:9781259666100Author:F. Robert Jacobs, Richard B ChasePublisher:McGraw-Hill Education
 Purchasing and Supply Chain ManagementOperations ManagementISBN:9781285869681Author:Robert M. Monczka, Robert B. Handfield, Larry C. Giunipero, James L. PattersonPublisher:Cengage Learning
 Production and Operations Analysis, Seventh Editi...Operations ManagementISBN:9781478623069Author:Steven Nahmias, Tava Lennon OlsenPublisher:Waveland Press, Inc.