
Operations Management
13th Edition
ISBN: 9781259667473
Author: William J Stevenson
Publisher: McGraw-Hill Education
expand_more
expand_more
format_list_bulleted
Concept explainers
Videos
Textbook Question
Chapter 3, Problem 26P
The following data were collected during a study of consumer buying patterns:
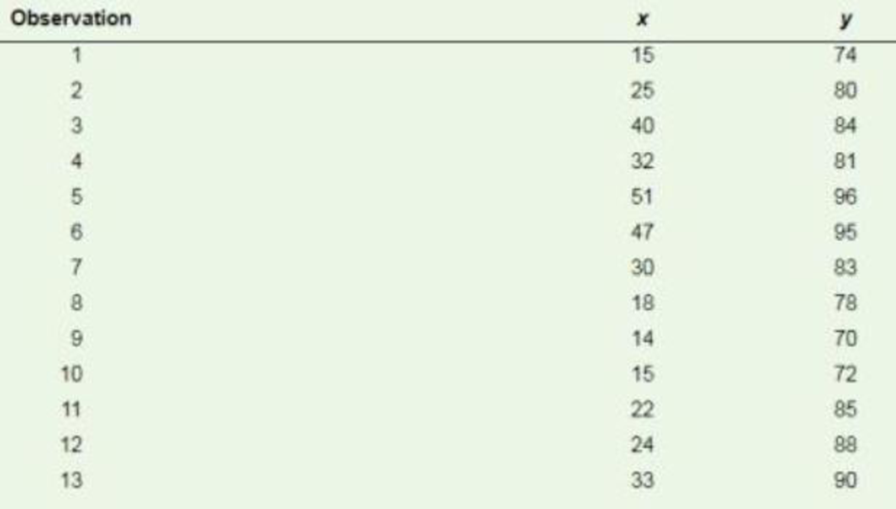
1. Plot the data.
2. Obtain a linear regression line foe the data.
3. What percentage of the variation is explained by the regression line?
4. Use the equation determined in part b to predict the expected value of y for x = 41.
Expert Solution & Answer
Want to see the full answer?
Check out a sample textbook solution
Students have asked these similar questions
A study to determine the correlation between bankdeposits and consumer price indices in Birmingham, Alabama,revealed the following (which was based on n = 5 years of da ta):• LX = 15• Lx2 = 55• Lxy = 70• Ly = 20• L/ = 130a) What is the equation of the least-squares regression line?b) Find the coefficient of correlation. What does it imply to you?c) What is the standard error of the estimate?
Create a line graph for this set of monthly sales numbers.
Run a regression analysis.
What is the regression equation?
Is the regression equation significant? How can you tell?
What is the Rsquare? What does this signify?
What is the sales forecast for month 13?
1
550
2
548
3
546
4
549
5
550
6
548
7
551
8
551
9
552
10
551
11
553
12
553
1.) Use the following dummy variables to develop an estimated regression equation to account for seasonal effects only in the data. Qtr1 = 1 if Quarter 1, 0otherwise; Qtr2 = 1 if Quarter 2, 0 otherwise, Qtr3 = 1 if Quarter 3, 0otherwise. Based only on the seasonal effects in the data, compute estimates of quarterly sales for year 6.a. Report the estimate of sales for Year 6 Quarter 1. (Enter a whole value.)b. Report the estimate of sales for Year 6 Quarter 4. (Enter a whole value.)2.) Let Period t = 1 refer to the observation in quarter 1 of year 1; Period t = 2refer to the observation in quarter 2 or year 1; … and Period t = 20 refer to the observation in quarter 4 of year 5. Using the dummy variables defined in part (b) and Period (t), develop an estimated regression equation to account for seasonal effects and any linear trend in the time series. Based upon the seasonal effects in the data and linear trend, compute the estimates of quarterly sales for year 6.a. Report the estimate…
Chapter 3 Solutions
Operations Management
Ch. 3.15 - Prob. 1.1RQCh. 3.15 - Prob. 1.2RQCh. 3.15 - Prob. 1.3RQCh. 3 - What are the main advantage that quantitative...Ch. 3 - What are some of the consequences of poor...Ch. 3 - List the specific weaknesses of each of these...Ch. 3 - Forecasts are generally wrong a. Why are forecasts...Ch. 3 - What is the purpose of establishing control limits...Ch. 3 - What factors would you consider in deciding...Ch. 3 - Contrast the use of MAD and MSE in evaluating...
Ch. 3 - What advantages as a forecasting tool does...Ch. 3 - How does the number of periods in a moving average...Ch. 3 - What factors enter into the choice of a value for...Ch. 3 - Prob. 11DRQCh. 3 - Explain how using a centered moving average with a...Ch. 3 - Contrast the terms sales and demand.Ch. 3 - Contrast the reactive and proactive approaches to...Ch. 3 - Explain how flexibility in production systems...Ch. 3 - How is forecasting in the context of a supply...Ch. 3 - Which type of forecasting approach, qualitative or...Ch. 3 - Prob. 18DRQCh. 3 - Choose the type of forecasting technique (survey,...Ch. 3 - Explain the trade-off between responsiveness and...Ch. 3 - Who needs to be involved in preparing forecasts?Ch. 3 - How has technology had an impact on forecasting?Ch. 3 - It has been said that forecasting using...Ch. 3 - What capability would an organization have to have...Ch. 3 - When a new business is started, or a patent idea...Ch. 3 - Discuss how you would manage a poor forecast.Ch. 3 - Omar has beard from some of his customers that...Ch. 3 - Give three examples of unethical conduct involving...Ch. 3 - A commercial baker, has recorded sales (in dozens)...Ch. 3 - National Scan, Inc., sells radio frequency...Ch. 3 - A dry cleaner uses exponential smoothing to...Ch. 3 - An electrical contractors records during the last...Ch. 3 - A cosmetics manufacturer s marketing department...Ch. 3 - Prob. 6PCh. 3 - Freight car loadings ova a 12-year period at a...Ch. 3 - Air travel on Mountain Airline for the past 18...Ch. 3 - a. Obtain the linear trend equation for the...Ch. 3 - After plotting demand for four periods, an...Ch. 3 - A manager of a store that sells and installs spas...Ch. 3 - The following equation summarizes the trend...Ch. 3 - Compute seasonal relatives for this data the SA...Ch. 3 - A tourist center is open on weekends (Friday,...Ch. 3 - The manager of a fashionable restaurant open...Ch. 3 - Obtain estimates of daily relatives for the number...Ch. 3 - A pharmacist has been monitoring sales of 2...Ch. 3 - New car sales for a dealer in Cook County,...Ch. 3 - The following table shows a tool and die companys...Ch. 3 - An analyst must decide between two different...Ch. 3 - Two different forecasting techniques (F1 and F2)...Ch. 3 - Two independent methods of forecasting based on...Ch. 3 - Long-Life Insurance has developed a linear model...Ch. 3 - Timely Transport provides local delivery service...Ch. 3 - The manager of a seafood restaurant was asked to...Ch. 3 - The following data were collected during a study...Ch. 3 - Lovely Lawns Inc., intends to use sales of lawn...Ch. 3 - The manager of a travel agency has been using a...Ch. 3 - Refer to the data in problem 22 a. Compute a...Ch. 3 - The classified department of a monthly magazine...Ch. 3 - A textbook publishing company has compiled data on...Ch. 3 - A manager has just receded an valuation from an...Ch. 3 - A manager uses this equation to predict demand for...Ch. 3 - A manager uses a trend equation plus quarterly...Ch. 3 - ML MANUFACTURING ML Manufacturing makes various...Ch. 3 - ML MANUFACTURING ML Manufacturing makes various...Ch. 3 - HIGHLINE FINANCIAL SERVICES, LTD. Highline...
Knowledge Booster


Learn more about
Need a deep-dive on the concept behind this application? Look no further. Learn more about this topic, operations-management and related others by exploring similar questions and additional content below.Similar questions
- The owner of a restaurant in Bloomington, Indiana, has recorded sales data for the past 19 years. He has also recorded data on potentially relevant variables. The data are listed in the file P13_17.xlsx. a. Estimate a simple regression equation involving annual sales (the dependent variable) and the size of the population residing within 10 miles of the restaurant (the explanatory variable). Interpret R-square for this regression. b. Add another explanatory variableannual advertising expendituresto the regression equation in part a. Estimate and interpret this expanded equation. How does the R-square value for this multiple regression equation compare to that of the simple regression equation estimated in part a? Explain any difference between the two R-square values. How can you use the adjusted R-squares for a comparison of the two equations? c. Add one more explanatory variable to the multiple regression equation estimated in part b. In particular, estimate and interpret the coefficients of a multiple regression equation that includes the previous years advertising expenditure. How does the inclusion of this third explanatory variable affect the R-square, compared to the corresponding values for the equation of part b? Explain any changes in this value. What does the adjusted R-square for the new equation tell you?arrow_forwardDo the sales prices of houses in a given community vary systematically with their sizes (as measured in square feet)? Answer this question by estimating a simple regression equation where the sales price of the house is the dependent variable, and the size of the house is the explanatory variable. Use the sample data given in P13_06.xlsx. Interpret your estimated equation, the associated R-square value, and the associated standard error of estimate.arrow_forwardA small computer chip manufacturer wants to forecast monthly ozperating costs as a function of the number of units produced during a month. The company has collected the 16 months of data in the file P13_34.xlsx. a. Determine an equation that can be used to predict monthly production costs from units produced. Are there any outliers? b. How could the regression line obtained in part a be used to determine whether the company was efficient or inefficient during any particular month?arrow_forward
- Management of a home appliance store would like to understand the growth pattern of the monthly sales of Blu-ray disc players over the past two years. Managers have recorded the relevant data in the file P13_33.xlsx. a. Create a scatterplot for these data. Comment on the observed behavior of monthly sales at this store over time. b. Estimate an appropriate regression equation to explain the variation of monthly sales over the given time period. Interpret the estimated regression coefficients. c. Analyze the estimated equations residuals. Do they suggest that the regression equation is adequate? If not, return to part b and revise your equation. Continue to revise the equation until the results are satisfactory.arrow_forwardThe file P13_42.xlsx contains monthly data on consumer revolving credit (in millions of dollars) through credit unions. a. Use these data to forecast consumer revolving credit through credit unions for the next 12 months. Do it in two ways. First, fit an exponential trend to the series. Second, use Holts method with optimized smoothing constants. b. Which of these two methods appears to provide the best forecasts? Answer by comparing their MAPE values.arrow_forwardStock market analysts are continually looking for reliable predictors of stock prices. Consider the problem of modeling the price per share of electric utility stocks (Y). Two variables thought to influence this stock price are return on average equity (X1) and annual dividend rate (X2). The stock price, returns on equity, and dividend rates on a randomly selected day for 16 electric utility stocks are provided in the file P13_15.xlsx. Estimate a multiple regression equation using the given data. Interpret each of the estimated regression coefficients. Also, interpret the standard error of estimate and the R-square value for these data.arrow_forward
- Management of a home appliance store wants to understand the growth pattern of the monthly sales of a new technology device over the past two years. The managers have recorded the relevant data in the file P13_05.xlsx. Have the sales of this device been growing linearly over the past 24 months? By examining the results of a linear trend line, explain why or why not.arrow_forwardThe file P13_26.xlsx contains the monthly number of airline tickets sold by the CareFree Travel Agency. a. Create a time series chart of the data. Based on what you see, which of the exponential smoothing models do you think will provide the best forecasting model? Why? b. Use simple exponential smoothing to forecast these data, using a smoothing constant of 0.1. c. Repeat part b, but search for the smoothing constant that makes RMSE as small as possible. Does it make much of an improvement over the model in part b?arrow_forwardThe management of a technology company is trying to determine the variable that best explains the variation of employee salaries using a sample of 52 full-time employees; see the file P13_08.xlsx. Estimate simple linear regression equations to identify which of the following has the strongest linear relationship with annual salary: the employees gender, age, number of years of relevant work experience prior to employment at the company, number of years of employment at the company, or number of years of post secondary education. Provide support for your conclusion.arrow_forward
- The file P13_02.xlsx contains five years of monthly data on sales (number of units sold) for a particular company. The company suspects that except for random noise, its sales are growing by a constant percentage each month and will continue to do so for at least the near future. a. Explain briefly whether the plot of the series visually supports the companys suspicion. b. By what percentage are sales increasing each month? c. What is the MAPE for the forecast model in part b? In words, what does it measure? Considering its magnitude, does the model seem to be doing a good job? d. In words, how does the model make forecasts for future months? Specifically, given the forecast value for the last month in the data set, what simple arithmetic could you use to obtain forecasts for the next few months?arrow_forwardUnder what conditions might a firm use multiple forecasting methods?arrow_forwardThe file P13_22.xlsx contains total monthly U.S. retail sales data. While holding out the final six months of observations for validation purposes, use the method of moving averages with a carefully chosen span to forecast U.S. retail sales in the next year. Comment on the performance of your model. What makes this time series more challenging to forecast?arrow_forward
arrow_back_ios
SEE MORE QUESTIONS
arrow_forward_ios
Recommended textbooks for you
 Practical Management ScienceOperations ManagementISBN:9781337406659Author:WINSTON, Wayne L.Publisher:Cengage,
 Contemporary MarketingMarketingISBN:9780357033777Author:Louis E. Boone, David L. KurtzPublisher:Cengage Learning
 MarketingMarketingISBN:9780357033791Author:Pride, William MPublisher:South Western Educational Publishing
Practical Management Science
Operations Management
ISBN:9781337406659
Author:WINSTON, Wayne L.
Publisher:Cengage,
Contemporary Marketing
Marketing
ISBN:9780357033777
Author:Louis E. Boone, David L. Kurtz
Publisher:Cengage Learning
Marketing
Marketing
ISBN:9780357033791
Author:Pride, William M
Publisher:South Western Educational Publishing
Single Exponential Smoothing & Weighted Moving Average Time Series Forecasting; Author: Matt Macarty;https://www.youtube.com/watch?v=IjETktmL4Kg;License: Standard YouTube License, CC-BY
Introduction to Forecasting - with Examples; Author: Dr. Bharatendra Rai;https://www.youtube.com/watch?v=98K7AG32qv8;License: Standard Youtube License