
Subparts (a):
The quantity supplied.
Given information:
Figure 1 shows the Supply curve ‘S1’ for tennis balls:
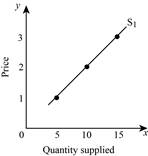
Table -1 shows the quantity supplied (S1 and S2) and its changes:
| Price |
‘S1’ Quantity supplied | ‘S2’ Quantity supplied | Change in quantity supplied |
| 3 | - | 4 | - |
| 2 | - | 2 | - |
| 1 | - | 0 | - |
Subparts (b):
The quantity supplied.
Given information:
Figure 1 shows the Supply curve ‘S1’ for tennis balls:
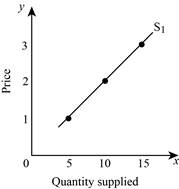
Table -1 shows the quantity supplied (S1 and S2) and its changes:
| Price |
‘S1’ Quantity supplied | ‘S2’ Quantity supplied | Change in quantity supplied |
| 3 | - | 4 | - |
| 2 | - | 2 | - |
| 1 | - | 0 | - |
Subparts (c):
The quantity supplied.
Given information:
Figure 1 shows the Supply curve ‘S1’ for tennis balls:

Table -1 shows the quantity supplied (S1 and S2) and its changes:
| Price |
‘S1’ Quantity supplied | ‘S2’ Quantity supplied | Change in quantity supplied |
| 3 | - | 4 | - |
| 2 | - | 2 | - |
| 1 | - | 0 | - |
Subparts (d):
The quantity supplied.
Given information:
Figure 1 shows the Supply curve ‘S1’ for tennis balls:

Table -1 shows the quantity supplied (S1 and S2) and its changes:
| Price |
‘S1’ Quantity supplied | ‘S2’ Quantity supplied | Change in quantity supplied |
| 3 | - | 4 | - |
| 2 | - | 2 | - |
| 1 | - | 0 | - |

Trending nowThis is a popular solution!

Chapter 3 Solutions
MACROECONOMICS W/CONNECT:LOOSE>CUSTOM<

- The following table summarizes information about the market for principles of economics textbooks: Price Quantity Demanded per Year Quantity Supplied per Year $45 4,300 300 55 2,300 700 65 1,300 1,300 75 800 2,100 85 650 3,100 What is the market equilibrium price and quantity of textbooks? To quell outrage over tuition increases, the college places a $55 limit on the price of textbooks. How many textbooks will be sold now? While the price limit is still in effect, automated publishing increases the efficiency of textbook production. Show graphically the likely effect of this innovation on the market price and quantity.arrow_forwardWhat is the difference between the supply and the quantity supplied of a product, say milk? Explain in words and show the difference on a graph with the supply curve for milk.arrow_forwardThe computer market in recent years has seen many more computing sell at much lower prices. What shift in demand or supply is most likely to explain this outcome? Sketch a demand and supply diagram and explain your reasoning for each. A rise in demand A fall in demand A rise in supply A fall in supplyarrow_forward
 Microeconomics: Private and Public Choice (MindTa...EconomicsISBN:9781305506893Author:James D. Gwartney, Richard L. Stroup, Russell S. Sobel, David A. MacphersonPublisher:Cengage Learning
 Economics: Private and Public Choice (MindTap Cou...EconomicsISBN:9781305506725Author:James D. Gwartney, Richard L. Stroup, Russell S. Sobel, David A. MacphersonPublisher:Cengage Learning
 Exploring EconomicsEconomicsISBN:9781544336329Author:Robert L. SextonPublisher:SAGE Publications, Inc
 Microeconomics: Principles & PolicyEconomicsISBN:9781337794992Author:William J. Baumol, Alan S. Blinder, John L. SolowPublisher:Cengage Learning
 Principles of Economics 2eEconomicsISBN:9781947172364Author:Steven A. Greenlaw; David ShapiroPublisher:OpenStax