Videos
Software defects in NASA spacecraft instrument code. Portions of computer software code that may contain undetected defects are called blind spots. The issue of blind spots in software code evaluation was addressed at the 8th IEEE International Symposium on High Assurance Software Engineering (March 2004 ). The researchers developed guidelines for assessing methods of predicting software defects using data on 498 modules of software code written in “C” language for a NASA spacecraft instrument. One simple prediction algorithm is to count the lines of code in the module; any module with more than 50 lines of code is predicted to have a defect. The accompanying file contains the predicted and actual defect status of all 498 modules. A standard approach to evaluating a software defect prediction algorithm is to form a two-way summary table similar to the one shown here. In the table, a, b, c, and d represent the number of modules in each cell. Software engineers use these table entries to compute several probability measures, called accuracy, detection rate, false alarm rate, and precision.
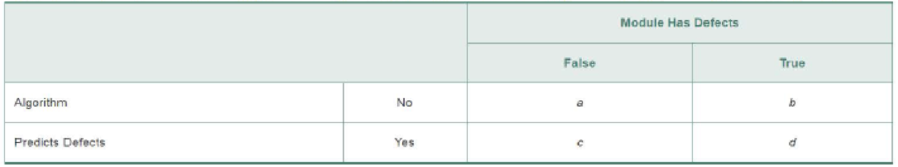
- a. Accuracy is defined as the probability that the prediction algorithm is correct. Write a formula for accuracy as a
function of the table values a, b, c, and d. - b. The detection rate is defined as the probability that the algorithm predicts a defect, given that the module actually is a defect. Write a formula for detection rate as a function of the table values a, b, c, and d.
- c. The false alarm rate is defined as the probability that the algorithm predicts a defect, given that the module actually has no defect. Write a formula for false alarm rate as a function of the table values a, b, c, and d.
- d. Precision is defined as the probability that the module has a defect, given that the algorithm predicts a defect. Write a formula for precision as a function of the table values a, b, c, and d.
- e. Access the accompanying file and compute the values of accuracy, detection rate, false alarm rate, and precision. Interpret the results.
Want to see the full answer?
Check out a sample textbook solution
Chapter 3 Solutions
Statistics For Business And Economics, Student Value Edition Plus Mystatlab With Pearson Etext -- Access Card Package (13th Edition)
Additional Math Textbook Solutions
Statistics: Informed Decisions Using Data (5th Edition)
Elementary Statistics (Text Only)
Fundamentals of Statistics (5th Edition)
STATS:DATA+MODELS-W/DVD
Business Statistics: A First Course (8th Edition)
Elementary Statistics: A Step By Step Approach


- Consider the following research hypothesis and the p-value obtained via a statistical test. Would this testing have involved one-sample or two-sample hypothesis testing? Does the scenario involved paired or independent samples?Assuming the appropriate testing was used, what would be an appropriate conclusion to draw given the reported results and p-value?Explain the reasoning for your answers.The hypothesis is that students who are familiar with the Theory of Algorithms learn the programming language C++ faster than students who are not familiar with this theory. We have gathered data from 50 students who are familiar with the Theory of Algorithms (Group 1) and 40 students who are not familiar with the Theory of Algorithms (Group 2). Experiments showed students from Group 1 took a mean of 36.5 hours to complete the training course of C++, while students Group 2 the mean was 39.1 hours. The p-value was 0.04.arrow_forwardConsider the following research hypothesis and the p-value obtainedvia a statistical test. Would this testing have involved one-sample or two-sample hypothesis testing? Does the scenario involved paired or independent samples?Assuming the appropriate testing was used, what would be an appropriate conclusion to draw given the reported results and p-value? Explain the reasoning for your answers. The hypothesis is that students who are familiar with the Theory of Algorithms learn the programming language C++ faster than students who are not familiar with this theory. We have gathered data from 30 students who are familiar with the Theory of Algorithms (Group 1) and 30 students who are not familiar with the Theory of Algorithms (Group 2). Experiments showed students from Group 1 took a mean of 32.5 hours to complete the training course of C++, while students Group 2 the mean was 42.1 hours. The p-value was 0.14arrow_forwardDue to COVID19, airlines cut services, such as meals and snacks during flights, and started charging for luggage. However, they are still concerned about service. A group of four carriers hired Denny's Marketing Research Inc. to survey passengers regarding their level of satisfaction with a recent flight. The survey included questions on ticketing, boarding, in-flight service, baggage handling, pilot communication, and so forth. Twenty-five questions offered a range of possible answers: excellent, good, fair, or poor. A response of excellent was given a score of 4, good a 3, fair a 2, and poor a 1. These responses were then totaled, so the total score was an indication of the satisfaction with the flight. The greater the score, the higher the level of satisfaction with the service. The highest possible score was 100. Denny randomly selected and surveyed passengers from the four airlines. Below is the sample information. Is there a difference in the mean satisfaction level among the…arrow_forward
- In many colleges, educators are changing their approach to instruction from a “teacher/lecture-centeredmodel” to a “student-centered model” where students learn in a laboratory environment in which lectureis deemphasized and students can proceed at a pace suitable to their learning needs. In once schoolwhere this model was being introduced, of the 743 students who enrolled in the traditional lecture model, 364 passed; of the 567 in the student-centered model, 335 passed. Use a 0.05 level ofsignificance to test the claim that student-centered model results in a higher pass rate than the traditionalmodel?arrow_forward6. A researcher develop one new prediction algorithm. He want to find out whether hisalgorithm predict a situation faster than the current method. He test his algorithm to makea prediction base on 4 sets of data. He recorded the computation time in microsecond andcompare it with current method and standard method. Table 5 give the computation timefor all method tested.TABLE 5Proposed Method Current Method Standard Method10 11 1313 16 177 9 915 16 19At 2.5% significance level, will you conclude that the computation time taken to predict is thedifferent for each of the three algorithms.arrow_forwardThe predicted outcome of the 2020 US election was 5/9 in favour of Joe Biden. What is theaverage information content of this process?arrow_forward
- A study was performed concerning medical emergencies on commercial airline flights. A database was constructed based on calls to a medical communications center from 5 domestic and international airlines representing approximately 15% of the global passenger flight volume from January 2005 to December 2007. There were 11,000 in flight medical emergencies (IFM) among 8,000,000 flights during the study period. Assume that there is at most 1 IFM per flight. Suppose a flight attendant works on 3 flights per day for each of 300 days per year. Also, assume that the flight attendant’s total duration of employment is 20 years. What is the approximate probability that he/she encounter at least 5 IFM’s over a 20 year period? (b) Suppose we observe 80 alcoholics with cirrhosis of the liver, of whom 25 have hepatomas, that is, liver cell carcinoma. Suppose we know, based on a large sample, that t`he risk of hepatoma among alcoholics without cirrhosis of the liver is 25%. What is the approximate…arrow_forwardWhat is the hand computation step by step with the guidlines of the software? Your professor is interested in determining if mode of presentation affects how prose material is remembered. She used one prose passage that was presented visually and auditorily. From 200 undergraduate students in the university, only 10agreed to participate. On the first day of the experiment, the 10participants receives visual presentation of the prose passage while on the second day, same participants hears the passages through an auditory presentation. At the end of each presentations, participants were asked to say as much of the material as they can remember within 2 minutes. The words remembered were obtained. Use Student’s tTest for Correlated Groups, alpha at .05 2 tail Visual - 4 2 5 8 2 3 3 2 5 6 Auditory- 4 4 5 9 8 4 4 5 8 6arrow_forwardA plant physiologist studying a small beach-dwelling plant called the Great Lakes sea rocket, Cakile edentula, wondered if the plants grew faster in competition with non-kin plants than when in competition with seedlings that are close relatives. She set up a direct study of kin recognition by growing sets of four seeds in one container. When the seedlings reached a phase of vigorous root growth, about 8 weeks after planting, she carefully removed the soil and weighed the root masses. Plants grouped with siblings had the following root weight statistics: n = 24 X = 6.25 g s = 0.47 g Plants grouped with unrelated seedlings had the following root weight statistics: n = 20 X = 7.22 g s = 0.55 g Are the plants grown in competition with unrelated individuals allocating sig- nificantly more resources to root growth than those growing among relatives?arrow_forward
- Do math skills matter when looking for gainful employment? The latest U.S. Department of Educa-tion National Assessment of Adult Literacy was conducted in 2003. A random sample of 18,102 adults (aged 16+) livingin U.S. households were tested on Quantitative Literacy andasked whether they thought that their math skills limited theirjob opportunities. Quantitative Literacy was measured as arespondent’s ability to identify and perform computations M12_BOCK4018_04_SE_C12.indd 336 04/12/13 4:45 PM Parts I-III Practice Exam 337 using data embedded in printed materials such as balanc-ing a checkbook, figuring out a tip, completing an order form, or determining the amount of interest on a loan froman advertisement. Respondents were placed into one of fourcategories (Below Basic, Basic, Intermediate, or Proficient)based upon their scores on various tasks. The table belowsummarizes the data that were collected.1. What percentage of those with Basic quantitative skillsthink that their math skills…arrow_forwardPeople are classified as hypertensive if their systolic blood pressure (SBP) is higher than a specified level for their age group, according to the algorithm in the table below. Assume SBP is normally distributed with mean, and standard given in the table for age groups 1 – 14 and 15 – 44, respectively. Define a family as a group of two people in age group 1 – 14 and two people in age group 15 – 44. A family is classified as hypertensive if at least one adult and at least one child are hypertensive. i. What proportion of 1 – 14-year-olds are hypertensive? ii. What proportion of 15 – 44-year-olds are hypertensive?arrow_forwardA sampled injection-molded part could have been produced in either one of two presses and in any one of the eight cavities in each press. Use tree diagram.arrow_forward
 MATLAB: An Introduction with ApplicationsStatisticsISBN:9781119256830Author:Amos GilatPublisher:John Wiley & Sons Inc
 Probability and Statistics for Engineering and th...StatisticsISBN:9781305251809Author:Jay L. DevorePublisher:Cengage Learning
 Statistics for The Behavioral Sciences (MindTap C...StatisticsISBN:9781305504912Author:Frederick J Gravetter, Larry B. WallnauPublisher:Cengage Learning
 Elementary Statistics: Picturing the World (7th E...StatisticsISBN:9780134683416Author:Ron Larson, Betsy FarberPublisher:PEARSON
 The Basic Practice of StatisticsStatisticsISBN:9781319042578Author:David S. Moore, William I. Notz, Michael A. FlignerPublisher:W. H. Freeman
 Introduction to the Practice of StatisticsStatisticsISBN:9781319013387Author:David S. Moore, George P. McCabe, Bruce A. CraigPublisher:W. H. Freeman