
Concept explainers
Videos
a.
Draw a
a.
Answer to Problem 3.30SE
The relation is linear and positive.
Explanation of Solution
Given:
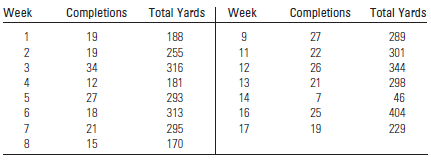
The table shows therelation between the number of passes completed and the total number of passing yards.
Calculation:
The scatterplot for the given points are.

The horizontal axis x represents the completion and the vertical axis y represents the total yards.
b.
Find the relationship between pretest and posttest scores.
b.
Answer to Problem 3.30SE
The relationship is positive, moderately strong and linear and the outlier is
Explanation of Solution
Given:
The table shows the relation between the number of passes completed and the total number of passing yards.

Calculation:
The scatterplot for the given points are.
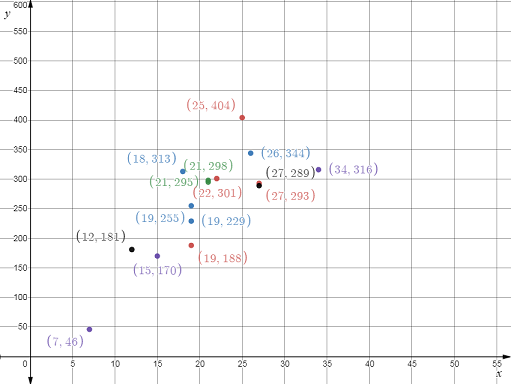
The horizontal axis x represents the completion and the vertical axis y represents the total yards.
In the scatterplot,
The pattern position is upward
Strength
Formed
Outliers
Hence the relationship is positive, moderately strong and linear and the outlier is
c.
Find the
c.
Answer to Problem 3.30SE
The
Explanation of Solution
Given:
The table shows the relation between the number of passes completed and the total number of passing yards.

Calculation:
First determine
Find the sample variance
Where
Find sample standard deviation.
For covariance
Find the correlation coefficient
Hence the correlation coefficient
d.
Find the correlation coefficient using the given points.
d.
Answer to Problem 3.30SE
The regression line is
Explanation of Solution
Given:
The table shows the relation between the number of passes completed and the total number of passing yards.

Calculation:
First determine
Find the sample variance
Where
Find sample standard deviation.
For covariance
Find the correlation coefficient
Hence the correlation coefficient
Find the slope
Find the value of y-intercept.
Regression line is
Hence the regression line is
e.
Find the total number of passing yards for given completion.
e.
Answer to Problem 3.30SE
The total number of yards is
Explanation of Solution
Given:
The given completion is
Calculation:
The equation is
Substitute the value of
Hence the total number of yards is
Want to see more full solutions like this?
Chapter 3 Solutions
Introduction to Probability and Statistics


 Glencoe Algebra 1, Student Edition, 9780079039897...AlgebraISBN:9780079039897Author:CarterPublisher:McGraw Hill
 Big Ideas Math A Bridge To Success Algebra 1: Stu...AlgebraISBN:9781680331141Author:HOUGHTON MIFFLIN HARCOURTPublisher:Houghton Mifflin Harcourt