
Concept explainers
Videos
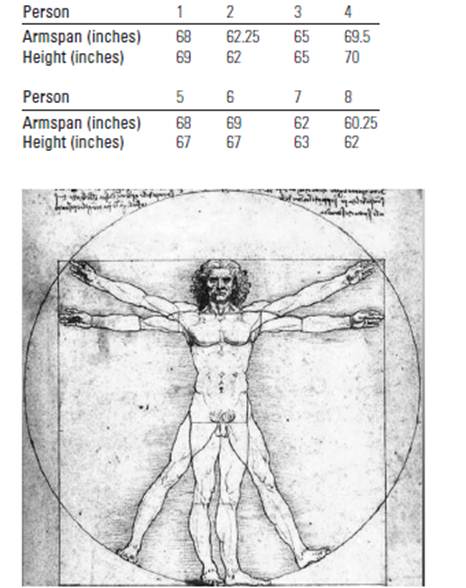
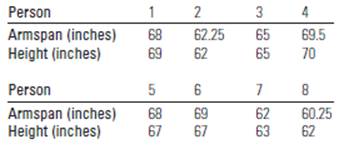
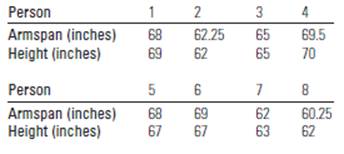
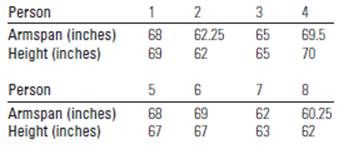
Armspan and Height Leonardo da Vinci (1452-1519) drew a sketch of a man, indication that a person’s armspan (meausring across the back with arms outstretched to make a “T”) is roughly equal to the person’s height. To test this claim, we measured eight people with the following results:
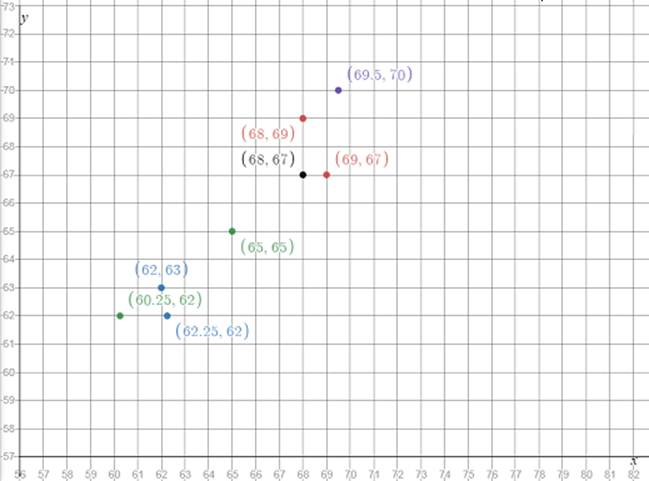
- Draw sactterplot for armspan and height. Use the same scale on both the horizontal and vertical axes. Describe the relationship between the two variables.
- Calculate the
correlation coefficient relating armspan and height. - If you were to calculate the regression line for predicting height based on a person’s armspan, how would you estimate the slope of this line?
- Find the regression line relating armspan to a person’s height.
- If a person has an armspan of 62 inches, what would you predict the person’s height to be?
a.
Draw a scatterplot for the given relationship.
Answer to Problem 3.35SE
The scatterplot is.
Explanation of Solution
Given:
The table shows the relation betweeneight people’s armspan and height.

Calculation:
The scatterplot for the given points are.

The horizontal axis x represents armspn and the vertical axis y represents the height.
b.
Find the correlation coefficient using the given points.
Answer to Problem 3.35SE
The correlation coefficient is
Explanation of Solution
Given:
The table shows the relation between eight people’s armspan and height.
Calculation:
First determine
Find the sample variance
Where
Find sample standard deviation.
For covariance
Find the correlation coefficient
Hence the correlation coefficient is
c.
Find the slope of the line.
Answer to Problem 3.35SE
The slope of the line is
Explanation of Solution
The table shows the relation between eight people’s armspan and height.
Calculation:
First determine
Find the sample variance
Where
Find sample standard deviation.
For covariance
Find the correlation coefficient
Find the slope
Hence the slope of the line is
d.
Find the regression line using the given points.
Answer to Problem 3.35SE
The regression line is
Explanation of Solution
The table shows the relation between eight people’s armspan and height.
Calculation:
First determine
Find the sample variance
Where
Find sample standard deviation.
For covariance
Find the correlation coefficient
Find the slope
Find the value of y-intercept.
Regression line is
Hence the regression line is
e.
Find the height of the person for given value of armspan.
Answer to Problem 3.35SE
The person’s height is
Explanation of Solution
The given value of armspan is
Calculation:
The regression line is
Substitute
Hence the person’s height is
Want to see more full solutions like this?
Chapter 3 Solutions
Introduction to Probability and Statistics


- Read the setting on this customary vernier micrometer scale graduated to 0.0001". The vernier, thimble, and barrel scales are shown in flattened view.arrow_forwardA piece shown by the shaded portion is to be cut from a square plate 128 millimeters on a side. a. Compute the area of the piece to be cut. Round the answer to the nearest square millimeter. b. After cutting the piece, determine the percentage of the plate that will be wasted.arrow_forwardFind the length of x. Round the answer to 2 decimal places.arrow_forward
 Mathematics For Machine TechnologyAdvanced MathISBN:9781337798310Author:Peterson, John.Publisher:Cengage Learning,
 Holt Mcdougal Larson Pre-algebra: Student Edition...AlgebraISBN:9780547587776Author:HOLT MCDOUGALPublisher:HOLT MCDOUGAL
 Algebra & Trigonometry with Analytic GeometryAlgebraISBN:9781133382119Author:SwokowskiPublisher:Cengage
 Trigonometry (MindTap Course List)TrigonometryISBN:9781305652224Author:Charles P. McKeague, Mark D. TurnerPublisher:Cengage Learning
 Algebra: Structure And Method, Book 1AlgebraISBN:9780395977224Author:Richard G. Brown, Mary P. Dolciani, Robert H. Sorgenfrey, William L. ColePublisher:McDougal Littell