
Concept explainers
Videos
a.
Find the
a.
Answer to Problem 3.10E
Explanation of Solution
Given:
The given bivariate data is
Calculation:
First determine
For covariance
Where
Hence
b.
Find the
b.
Answer to Problem 3.10E
The value of
Explanation of Solution
Given:
The given bivariate data is
Calculation:
First determine
Find the sample variance
Find sample standard deviation.
For covariance
Where
Find the correlation coefficient
Hence the value of correlation coefficient
c.
Find the regression line using the given points.
c.
Answer to Problem 3.10E
The regression line is
Explanation of Solution
Given:
The given bivariate data is
Calculation:
First determine
Find the sample variance
Find sample standard deviation.
For covariance
Where
Find the correlation coefficient
Find the slope
Find the value of y-intercept.
Regression line is
Hence the regression line is
d.
Draw a
d.
Answer to Problem 3.10E
The scatterplot is
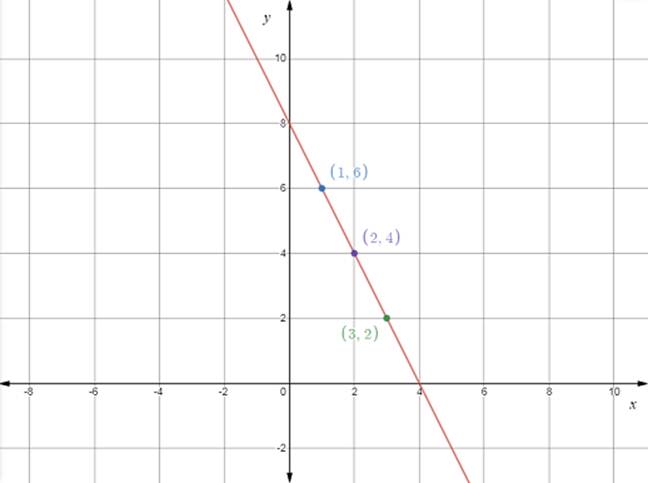
Explanation of Solution
Given:
The given bivariate data is
Calculation:
The equation is
The scatterplot for the given points are.

Want to see more full solutions like this?
Chapter 3 Solutions
Introduction to Probability and Statistics


 Glencoe Algebra 1, Student Edition, 9780079039897...AlgebraISBN:9780079039897Author:CarterPublisher:McGraw Hill