
Mind on Statistics
5th Edition
ISBN: 9781285463186
Author: Jessica M. Utts, Robert F. Heckard
Publisher: Brooks Cole
expand_more
expand_more
format_list_bulleted
Concept explainers
Videos
Textbook Question
Chapter 3, Problem 3.3E
The figure for this exercise is a
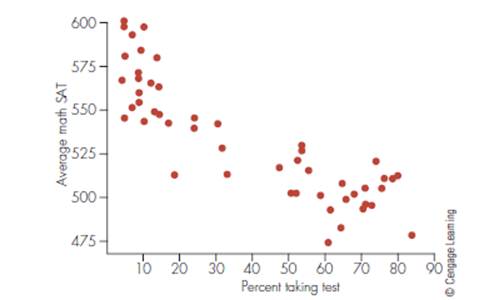
- Does the plot show a positive association, a negative association, or no association between the two variables? Explain.
Expert Solution & Answer
Want to see the full answer?
Check out a sample textbook solution
Chapter 3 Solutions
Mind on Statistics
Ch. 3 - For each of the following pairs of variables, is...Ch. 3 - For each of the following pairs of variables, is...Ch. 3 - The figure for this exercise is a scatter plot of...Ch. 3 - Prob. 3.4ECh. 3 - Prob. 3.5ECh. 3 - Prob. 3.6ECh. 3 - Prob. 3.7ECh. 3 - Prob. 3.8ECh. 3 - The data in the following table are the geographic...Ch. 3 - Refer to the latitude and temperature data in the...
Ch. 3 - Prob. 3.11ECh. 3 - The following table shows sex, height (inches),...Ch. 3 - Prob. 3.13ECh. 3 - Refer to Exercise 3.13 in which a regression...Ch. 3 - Prob. 3.15ECh. 3 - Prob. 3.16ECh. 3 - The equation for converting a temperature from x =...Ch. 3 - The average August temperatures (y) and geographic...Ch. 3 - A regression equation for y = handspan (cm) and x...Ch. 3 - Imagine a regression line that relates y average...Ch. 3 - Prob. 3.21ECh. 3 - The figure for Exercise 3.8 is a scatterplot of...Ch. 3 - Refer to Exercise 3.22. Predict the pulse rate...Ch. 3 - The average January temperatures (y) and...Ch. 3 - Prob. 3.25ECh. 3 - Prob. 3.26ECh. 3 - Prob. 3.27ECh. 3 - Remember that r2 can be expressed as a proportion...Ch. 3 - Prob. 3.29ECh. 3 - Prob. 3.30ECh. 3 - Prob. 3.31ECh. 3 - Prob. 3.32ECh. 3 - Prob. 3.33ECh. 3 - Explain how two variables can have a perfect...Ch. 3 - Prob. 3.35ECh. 3 - Prob. 3.36ECh. 3 - The figure for this exercise (below) shows four...Ch. 3 - Refer to the figure for the previous exercises. In...Ch. 3 - Prob. 3.39ECh. 3 - Prob. 3.40ECh. 3 - Prob. 3.41ECh. 3 - Prob. 3.42ECh. 3 - Prob. 3.43ECh. 3 - The correlation between latitude and average...Ch. 3 - Prob. 3.45ECh. 3 - Prob. 3.46ECh. 3 - In a regression analysis, the total sum of squares...Ch. 3 - Prob. 3.48ECh. 3 - Suppose you know that the slope of a regression...Ch. 3 - Prob. 3.50ECh. 3 - Prob. 3.51ECh. 3 - Prob. 3.53ECh. 3 - Prob. 3.54ECh. 3 - Refer back to Exercise 3.7 about stopping distance...Ch. 3 - Prob. 3.56ECh. 3 - Prob. 3.57ECh. 3 - Prob. 3.58ECh. 3 - Prob. 3.59ECh. 3 - Prob. 3.60ECh. 3 - Prob. 3.61ECh. 3 - Prob. 3.62ECh. 3 - Prob. 3.63ECh. 3 - Prob. 3.64ECh. 3 - Prob. 3.65ECh. 3 - Prob. 3.66ECh. 3 - Prob. 3.67ECh. 3 - Prob. 3.68ECh. 3 - Prob. 3.69ECh. 3 - Prob. 3.70ECh. 3 - Prob. 3.71ECh. 3 - Given tickets for traffic violations than drivers...Ch. 3 - Prob. 3.73ECh. 3 - Prob. 3.74ECh. 3 - Prob. 3.75ECh. 3 - Prob. 3.76ECh. 3 - Prob. 3.77ECh. 3 - Prob. 3.78ECh. 3 - Prob. 3.79ECh. 3 - The heights (inches) and foot lengths (cm) of 33...Ch. 3 - Prob. 3.81ECh. 3 - The winning time in the Olympic men’s 500-meter...Ch. 3 - Prob. 3.83ECh. 3 - Prob. 3.84ECh. 3 - Prob. 3.86ECh. 3 - Prob. 3.87ECh. 3 - Prob. 3.88ECh. 3 - Prob. 3.89ECh. 3 - Use the dataset ceodata0t on the companion website...Ch. 3 - Prob. 3.91ECh. 3 - Prob. 3.92ECh. 3 - Prob. 3.93ECh. 3 - Prob. 3.94ECh. 3 - Prob. 3.95ECh. 3 - Prob. 3.96ECh. 3 - Prob. 3.97ECh. 3 - Prob. 3.98ECh. 3 - Prob. 3.99ECh. 3 - Prob. 3.100E
Knowledge Booster


Learn more about
Need a deep-dive on the concept behind this application? Look no further. Learn more about this topic, statistics and related others by exploring similar questions and additional content below.Recommended textbooks for you
 Glencoe Algebra 1, Student Edition, 9780079039897...AlgebraISBN:9780079039897Author:CarterPublisher:McGraw Hill
 Big Ideas Math A Bridge To Success Algebra 1: Stu...AlgebraISBN:9781680331141Author:HOUGHTON MIFFLIN HARCOURTPublisher:Houghton Mifflin Harcourt
 Holt Mcdougal Larson Pre-algebra: Student Edition...AlgebraISBN:9780547587776Author:HOLT MCDOUGALPublisher:HOLT MCDOUGAL
Glencoe Algebra 1, Student Edition, 9780079039897...
Algebra
ISBN:9780079039897
Author:Carter
Publisher:McGraw Hill
Big Ideas Math A Bridge To Success Algebra 1: Stu...
Algebra
ISBN:9781680331141
Author:HOUGHTON MIFFLIN HARCOURT
Publisher:Houghton Mifflin Harcourt
Holt Mcdougal Larson Pre-algebra: Student Edition...
Algebra
ISBN:9780547587776
Author:HOLT MCDOUGAL
Publisher:HOLT MCDOUGAL
Which is the best chart: Selecting among 14 types of charts Part II; Author: 365 Data Science;https://www.youtube.com/watch?v=qGaIB-bRn-A;License: Standard YouTube License, CC-BY