
Mind on Statistics
5th Edition
ISBN: 9781285463186
Author: Jessica M. Utts, Robert F. Heckard
Publisher: Brooks Cole
expand_more
expand_more
format_list_bulleted
Concept explainers
Videos
Textbook Question
Chapter 3, Problem 3.9E
The data in the following table are the geographic latitudes and the average August and January temperatures (Fahrenheit) for 20 cities in the United States. The cities are listed in geographic order from south to north. (These data are part of the temperature dataset on the companion website.)
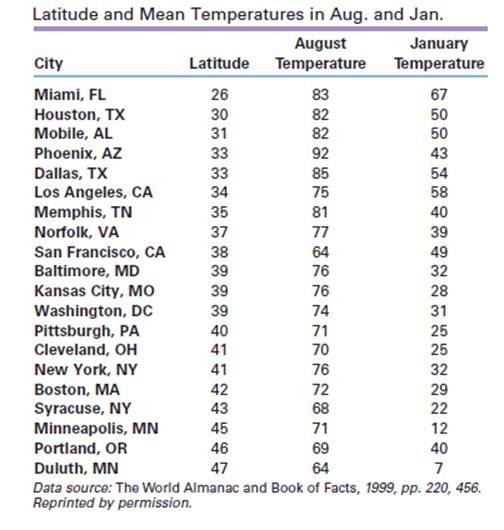
- Draw a
scatterplot of = August temperature versus x = latitude - Is the pattern linear or curvilinear? What is the direction of the association?
- Are there any cities that appear to be outliers because they don’t fit the pattern of the rest of the data? If so, which city or cities are they?
Expert Solution & Answer
Want to see the full answer?
Check out a sample textbook solution
Students have asked these similar questions
Also represent this pattern on a scatter plot
The National Football League (NFL) records a variety of performance data for individuals and teams. To investigate the importance of passing on the percentage of games won by a team, the following data show the average number of passing yards per attempt (Yds/Att) and the percentage of games won (WinPct) for a random sample of 10 NFL teams for the 2011 season (NFL website).
a. Choose the correct a scatter diagram with the number of passing yards per attempt on the horizontal axis and the percentage of games won on the vertical axis. C
b. What does the scatter diagram developed in part (a) indicate about the relationship between the two variables? The scatter diagram indicates a POSITIVE linear relationship between x= average number of passing yards per attempt and y= the percentage of games won by the team.
(NEED ANSWERS FOR C, D, and E)
c. Develop the estimated regression equation that could be used to predict the percentage of games won given the average number of passing yards per…
Which statement about the scatter plot is true?
Chapter 3 Solutions
Mind on Statistics
Ch. 3 - For each of the following pairs of variables, is...Ch. 3 - For each of the following pairs of variables, is...Ch. 3 - The figure for this exercise is a scatter plot of...Ch. 3 - Prob. 3.4ECh. 3 - Prob. 3.5ECh. 3 - Prob. 3.6ECh. 3 - Prob. 3.7ECh. 3 - Prob. 3.8ECh. 3 - The data in the following table are the geographic...Ch. 3 - Refer to the latitude and temperature data in the...
Ch. 3 - Prob. 3.11ECh. 3 - The following table shows sex, height (inches),...Ch. 3 - Prob. 3.13ECh. 3 - Refer to Exercise 3.13 in which a regression...Ch. 3 - Prob. 3.15ECh. 3 - Prob. 3.16ECh. 3 - The equation for converting a temperature from x =...Ch. 3 - The average August temperatures (y) and geographic...Ch. 3 - A regression equation for y = handspan (cm) and x...Ch. 3 - Imagine a regression line that relates y average...Ch. 3 - Prob. 3.21ECh. 3 - The figure for Exercise 3.8 is a scatterplot of...Ch. 3 - Refer to Exercise 3.22. Predict the pulse rate...Ch. 3 - The average January temperatures (y) and...Ch. 3 - Prob. 3.25ECh. 3 - Prob. 3.26ECh. 3 - Prob. 3.27ECh. 3 - Remember that r2 can be expressed as a proportion...Ch. 3 - Prob. 3.29ECh. 3 - Prob. 3.30ECh. 3 - Prob. 3.31ECh. 3 - Prob. 3.32ECh. 3 - Prob. 3.33ECh. 3 - Explain how two variables can have a perfect...Ch. 3 - Prob. 3.35ECh. 3 - Prob. 3.36ECh. 3 - The figure for this exercise (below) shows four...Ch. 3 - Refer to the figure for the previous exercises. In...Ch. 3 - Prob. 3.39ECh. 3 - Prob. 3.40ECh. 3 - Prob. 3.41ECh. 3 - Prob. 3.42ECh. 3 - Prob. 3.43ECh. 3 - The correlation between latitude and average...Ch. 3 - Prob. 3.45ECh. 3 - Prob. 3.46ECh. 3 - In a regression analysis, the total sum of squares...Ch. 3 - Prob. 3.48ECh. 3 - Suppose you know that the slope of a regression...Ch. 3 - Prob. 3.50ECh. 3 - Prob. 3.51ECh. 3 - Prob. 3.53ECh. 3 - Prob. 3.54ECh. 3 - Refer back to Exercise 3.7 about stopping distance...Ch. 3 - Prob. 3.56ECh. 3 - Prob. 3.57ECh. 3 - Prob. 3.58ECh. 3 - Prob. 3.59ECh. 3 - Prob. 3.60ECh. 3 - Prob. 3.61ECh. 3 - Prob. 3.62ECh. 3 - Prob. 3.63ECh. 3 - Prob. 3.64ECh. 3 - Prob. 3.65ECh. 3 - Prob. 3.66ECh. 3 - Prob. 3.67ECh. 3 - Prob. 3.68ECh. 3 - Prob. 3.69ECh. 3 - Prob. 3.70ECh. 3 - Prob. 3.71ECh. 3 - Given tickets for traffic violations than drivers...Ch. 3 - Prob. 3.73ECh. 3 - Prob. 3.74ECh. 3 - Prob. 3.75ECh. 3 - Prob. 3.76ECh. 3 - Prob. 3.77ECh. 3 - Prob. 3.78ECh. 3 - Prob. 3.79ECh. 3 - The heights (inches) and foot lengths (cm) of 33...Ch. 3 - Prob. 3.81ECh. 3 - The winning time in the Olympic men’s 500-meter...Ch. 3 - Prob. 3.83ECh. 3 - Prob. 3.84ECh. 3 - Prob. 3.86ECh. 3 - Prob. 3.87ECh. 3 - Prob. 3.88ECh. 3 - Prob. 3.89ECh. 3 - Use the dataset ceodata0t on the companion website...Ch. 3 - Prob. 3.91ECh. 3 - Prob. 3.92ECh. 3 - Prob. 3.93ECh. 3 - Prob. 3.94ECh. 3 - Prob. 3.95ECh. 3 - Prob. 3.96ECh. 3 - Prob. 3.97ECh. 3 - Prob. 3.98ECh. 3 - Prob. 3.99ECh. 3 - Prob. 3.100E
Knowledge Booster


Learn more about
Need a deep-dive on the concept behind this application? Look no further. Learn more about this topic, statistics and related others by exploring similar questions and additional content below.Similar questions
- Find the best straight line fit to the given data points: (-3, 7); (1, -1); and (3, -7)arrow_forwardThe red blood cell count of a healthy person was measured on each of 15 days. The number recorded is measured in 106 cells per microliter. 5.4 5.2 5.0 5.2 5.55.3 5.4 5.2 5.1 5.35.3 4.9 5.4 5.2 5.2 A. Choose from the two choices the most applicable graph to describe the data, is it dotplot or stem leaf plot and why? B. Describe the shape whether (symmetric, skewed left, skewed right) C. Describe the location of the red blood cell counts. D. If the person’s red blood cell count is measured today as 57 x 10^6, would you consider this unusual? What conclusions might you draw?arrow_forwardWhich statement is true about the data in the scatter plot?arrow_forward
- I have created two Box plot charts for my Sale transactions Dataset. But I need an interpretation for each of them to add to my report.arrow_forwardCould you please help me with the steps to create a scatter plot preferably in R code, thank you.arrow_forwardSuppose a researcher collects data on the gas mileage, measured in miles per gallon, for both city and highway driving in 35 cars. The data is plotted with city gas mileage on the horizontal axis and highway gas mileage on the vertical axis. The 1965 Triumph Herald is an outlier in the ?‑direction. What must be true about this car? A. This car is an influential observation. B. The highway gas mileage for this car is much higher or lower than other cars in the data set that have similar city gas mileage. C. The absolute value of the residual of this car is large. D. The city gas mileage for this car is much higher or lower than the rest of the cars in the data set. E. The highway gas mileage for this car is much higher or much lower than the rest of the cars in the data set.arrow_forward
arrow_back_ios
arrow_forward_ios
Recommended textbooks for you
 Big Ideas Math A Bridge To Success Algebra 1: Stu...AlgebraISBN:9781680331141Author:HOUGHTON MIFFLIN HARCOURTPublisher:Houghton Mifflin Harcourt
 Holt Mcdougal Larson Pre-algebra: Student Edition...AlgebraISBN:9780547587776Author:HOLT MCDOUGALPublisher:HOLT MCDOUGAL
 Glencoe Algebra 1, Student Edition, 9780079039897...AlgebraISBN:9780079039897Author:CarterPublisher:McGraw Hill
Big Ideas Math A Bridge To Success Algebra 1: Stu...
Algebra
ISBN:9781680331141
Author:HOUGHTON MIFFLIN HARCOURT
Publisher:Houghton Mifflin Harcourt
Holt Mcdougal Larson Pre-algebra: Student Edition...
Algebra
ISBN:9780547587776
Author:HOLT MCDOUGAL
Publisher:HOLT MCDOUGAL
Glencoe Algebra 1, Student Edition, 9780079039897...
Algebra
ISBN:9780079039897
Author:Carter
Publisher:McGraw Hill
Correlation Vs Regression: Difference Between them with definition & Comparison Chart; Author: Key Differences;https://www.youtube.com/watch?v=Ou2QGSJVd0U;License: Standard YouTube License, CC-BY
Correlation and Regression: Concepts with Illustrative examples; Author: LEARN & APPLY : Lean and Six Sigma;https://www.youtube.com/watch?v=xTpHD5WLuoA;License: Standard YouTube License, CC-BY