
Videos
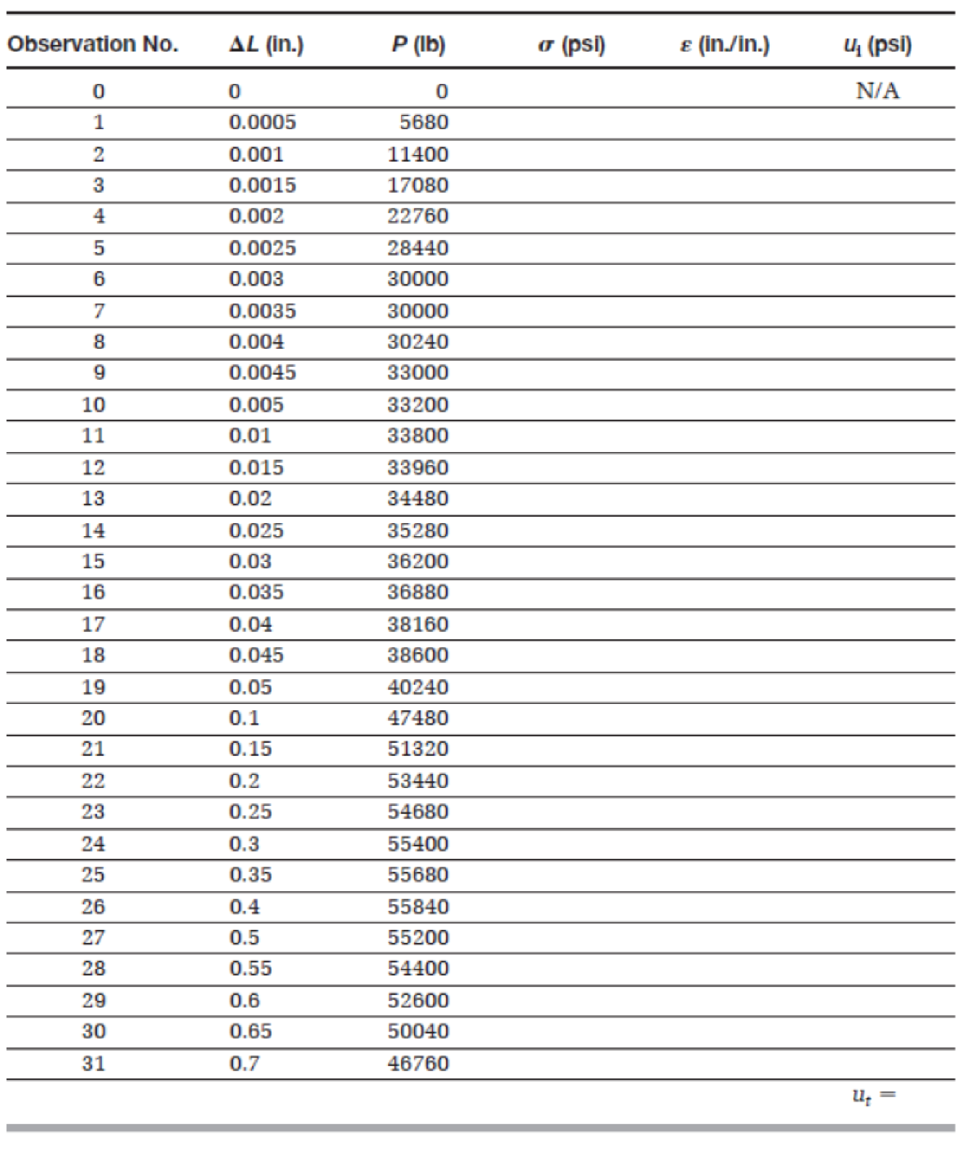
An engineering technician performed a tension test on an A36 mild steel specimen to fracture. The original cross-sectional area of the specimen is 0.25 in2 and the gauge length is 4.0 in. The information obtained from this experiment consists of applied tensile load (P) and increase in length (∆L) The results are tabulated in Table P3.44. Using a spreadsheet program, complete the table by calculating the engineering stress (σ) and the engineering strain (ε). Determine the toughness of the material (ut) by calculating the area under the stress-strain curve, namely,
where εf is the strain at fracture. The preceding integral can be approximated numerically using a trapezoidal integration technique:
TABLE P3.44
Want to see the full answer?
Check out a sample textbook solution
Chapter 3 Solutions
Pearson eText for Materials for Civil and Construction Engineers -- Instant Access (Pearson+)


- The results of a tensile test are shown in Table 1.5.2. The test was performed on a metal specimen with a circular cross section. The diameter was 3 8 inch and the gage length (The length over which the elongation is measured) was 2 inches. a. Use the data in Table 1.5.2 to produce a table of stress and strain values. b. Plot the stress-strain data and draw a best-fit curve. c. Compute the, modulus of elasticity from the initial slope of the curve. d. Estimate the yield stress.arrow_forwardA tensile test was performed on a metal specimen having a circular cross section with a diameter of 1 2 inch. The gage length (the length over which the elongation is measured) is 2 inches. For a load 13.5 kips, the elongation was 4.6610 3 inches. If the load is assumed to be within the linear elastic rang: of the material, determine the modulus of elasticity.arrow_forwardA tensile test was performed on a metal specimen having a circular cross section with a diameter 0. 510 inch. For each increment of load applied, the strain was directly determined by means of a strain gage attached to the specimen. The results are, shown in Table: 1.5.1. a. Prepare a table of stress and strain. b. Plot these data to obtain a stress-strain curve. Do not connect the data points; draw a best-fit straight line through them. c. Determine the modulus of elasticity as the slope of the best-fit line.arrow_forward
- Q2c) Listed in the table below is the tensile stress-strain data for different grades of steels. Utilizing the data given answer the three queries given below. Material Yield Tensile Strain at Fracture Elastic StrengthStrengthFractureStrengthModulus (MPa) (MPa) (MPa) (GPa) A 410 1440 0.63 265 410 В 200 220 0.40 105 250 C 815 950 0.25 500 610 D 800 650 0.14 720 210 E Fractures before yielding 650 550 1) Which will experience the greatest percent reduction in area? Why? 2) Which is the strongest? Why? 3) Which is the stiffest? Why?arrow_forwardA tensile test specimen of aluminum alloy having a diameter of 0.5 in. and a gage length of 2 in. was tested to fracture. The complete stress-strain diagram for this specimen is shown below to the left. The small strain portion of this diagram has been enlarged (to the right) to show in more detail the linear portion of the stress-strain diagram. Determine (a) Young's modulus or modulus of elasticity (i.e., the slope of linear portion), (b) yield stress (using the so-called 0.2% offset method from the lecture notes), (c) yield strain (i.e., the strain corresponding to yield stress, not the 0.2%!), (d) ultimate strength (i.e., the peak in stress-strain diagram), (e) rupture stress (i.e., stress at breaking/failure), (f) rupture strain (i.e., the strain corresponding to rupture stress). 80 70 70 60 60 50 50 40 30 30 20 20 10 10 0.005 0.01 0.015 0.02 Strain (in/in) Strain (in/in) Stress (ksi) 0.015 - 0.03 - 0.12 - 0.135 - 0.15 Stress (ksi)arrow_forwardTesting a round steel alloy bar with a diameter of 15 mm and a gauge length of 250 mm produced the stress–strain relationship shown in Figure Determinea. the elastic modulusb. the proportional limitc. the yield strength at a strain offset of 0.002d. the tensile strengthe. the magnitude of the load required to produce an increase in length of 0.38 mmf. the final deformation, if the specimen is unloaded after being strained by the amount specified in (e)g. In designing a typical structure made of this material, would you expect the stress applied in (e) reasonable? Why?arrow_forward
- The following data were obtained from the tensile test of Aluminum alloy. The initial diameter of test specimen was 0.505 inch and gauge length was 2.0 inch. Plot the stress strain diagram and determine (a) Proportional Limit (b) Modulus of Elasticity (c) Yield Stress at 0.2% offset (d) Ultimate Stress and (e) Nominal Rupture Stress. Load (Ib) Elongation (in.) Load (Ib) Elongation (in.) 14000 0.020 2310 0.0022 14400 0.025 4640 0.0044 14 500 0.060 6950 0.0066 14 600 0.080 9 290 0.0088 14 800 0.100 11 600 0.0110 14 600 0.120 13 000 0.0150 13 600 Fracturearrow_forwardA steel specimen is tested in tension. The specimen is 25 mm wide by 12.5 mm thick in the test region. By monitoring the load dial of the testing machine, it was found that the specimen yielded at a load of 160 kN and fractured at 214 kN. a. Determine the tensile stress at yield and at fracture. b. If the original gauge length was 100 mm, estimate the gauge length when the specimen is stressed to 1/2 the yield stress.arrow_forward3. The distribution of stress in an aluminum machine component is given (in megapascals) by Ox = y + z? Oy = x + z Oz = 3x + y Txy = 3z2 Tyz = x Txz = %3D Calculate the state of strain at a point positioned at (1,2,4). Use E=70 GPa and v = 0.3arrow_forward
- The following data were obtained from the tensile test of Aluminum alloy. The initial diameter of test specimen was 0.505 inch and gauge length was 2.0 inch. Plot the stress strain diagram and determine (a) Proportional Limit (b) Modulus of Elasticity (c) Yield Stress at 0.2% offset (d) Ultimate Stress and (e) Nominal Rupture Stress. st 0.8 015 Load (Ib) Elongation (in.) Load (Ib) Elongation (in.) 14 000 0.020 2310 0.0022 14400 0.025 4640 0.0044 14 500 0.060 6950 0.0066 14 600 0.080 9 290 0.0088 14 800 0.100 11 600 13 000 0.0110 14 600 0.120 0.0150 13 600 Fracturearrow_forwardThe data shown in the table below were obtained from a tensile test of high-strength steel. The test specimen had a diameter of 13mm and a gage length of 50mm. At the fracture, the elongation between the gage marks was 3.0mm and the minimum diameter was 10.7mm. Plot the conventional stress-strain curve for the steel and determine the proportional limit, modulus of elasticity (i.e the slope of initial part of the stress-strain curve), yield stress at 0.1% offset, ultimate stress, percent elongation in 50mm, and percentage reduction in area Tensile-Test Data Load(kN) Elongation (mm) 5 0.005 10 0.015 30 0.048 50 0.084 60 0.099 64.5 0.109 67.0 0.119 68.0 0.137 69.0 0.160 70.0 0.229 72.0 0.259 76.0 0.330 84.0 0.584 92.0 0.853 100.0 1.288 112.0 2.814 113.0 Fracturearrow_forward5. A tensile test was done on a magnesium sample of original diameter and original length of 12mm 30mm respectively. The final length and diameter were 32.61mm and 11.74mm respectively. Plot the stress versus strain graph and determine: a. 0.2% proof stress b. Tensile strength c. % elongation d. % reduction e. Stress at fracture f. Modulus of Elasticity. 66 Force (N) Ext. 0.0112 0.0157 0.0199 0.0240 1.72 (mm) 177 327 462 797 1350 1720 2220 2690 2690 5.55 8.15 13.07 22.77 25.25arrow_forward
 Steel Design (Activate Learning with these NEW ti...Civil EngineeringISBN:9781337094740Author:Segui, William T.Publisher:Cengage Learning
 Materials Science And Engineering PropertiesCivil EngineeringISBN:9781111988609Author:Charles GilmorePublisher:Cengage Learning