
Concept explainers
Videos
a.
To explain: The area within 1 standard deviation of the mean.
To compare: The area within 1 standard deviation of the mean by using applet and
a.
Answer to Problem 3.52E
The area within 1 standard deviation of the mean is 0.6826.
The area within 1 standard deviation of the mean by using applet and 68-95-99.7 rule is both approximately equal.
Explanation of Solution
Given info:
The mean and standard deviation of the
68-95-99.7 Rule:
About 68% of the observations fall within
About 95% of the observations fall within
About 99.7% of the observations fall within
Calculation:
Find the area of 1 standard deviation on either side of the mean using the normal density curve applet.
Applet procedure:
Step-by-step Applet procedure to find the area of 1 standard deviation on either side of the mean is given as follows:
- In Statistical Applets, choose Normal Density Curve.
- In the normal density curve drag one flag and place at 1 standard deviation on either side of the mean.
Output obtained from Applet:
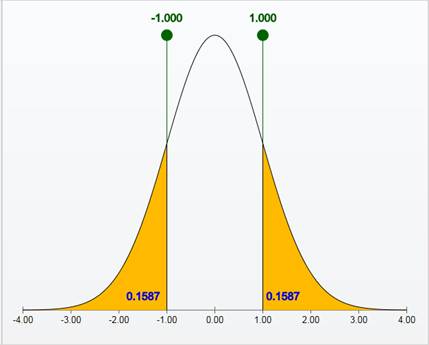
From the Applet output, the area of one standard deviation below −1 is 0.1587 and the above 1 is 0.1587.
The formula to find the area within 1 standard deviation of the mean is,
Thus, the area within 1 standard deviation of the mean is 0.6826. That is, about 68% of the observations fall within
From the 68-95-99.7 rule, the area within 1 standard deviation of the mean is about 68%.
Justification:
The result of the area within 1 standard deviation of the mean is approximately same by using the applet and the 68-95-99.7 rule.
b.
To explain: The area within 2 standard deviations of the mean and the area within 3 standard deviations of the mean.
To compare: The area within 2 standard deviations of the mean and the area within 3 standard deviations of the mean by using applet and 68-95-99.7 rule.
b.
Answer to Problem 3.52E
The area within 2 standard deviations of the mean is 0.9544 and the area within 3 standard deviations of the mean is 0.9974.
The area within 2 standard deviations of the mean by using applet and 68-95-99.7 rule is both approximately equal and the area within 3 standard deviations of the mean by using applet and 68-95-99.7 rule is both approximately equal.
Explanation of Solution
Calculation:
Finding the area of 2 standard deviations on either side of the mean:
Applet procedure:
Step-by-step Applet procedure to find the area of 2 standard deviations on either side of the mean is given as follows
- In Statistical Applets, choose Normal Density Curve.
- In the normal density curve drag one flag and place at 2 standard deviations on either side of the mean.
Output obtained from Applet:
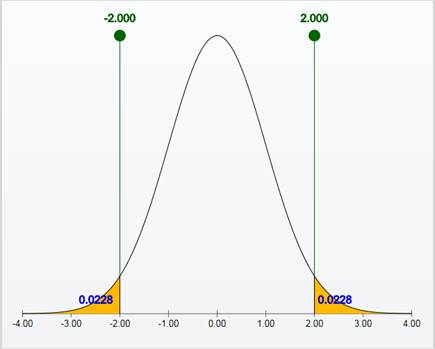
From the Applet output, the area to the left of −2 is 0.0228 and the area to right of 2 is 0.0228.
The formula to find the area within 2 standard deviations of the mean is,
Thus, the area within 2 standard deviations of the mean is 0.9544. That is, about 95% of the observations fall within
From the 68-95-99.7 rule, the area within 2 standard deviations of the mean is about 95%.
Finding the area of 3 standard deviations on either side of the mean:
Applet Procedure:
Step-by-step Applet procedure to find the area of 3 standard deviations on either side of the mean is given as follows
- In Statistical Applets, choose Normal Density Curve.
- In the normal density curve drag one flag and place at 3 standard deviations on either side of the mean.
Output obtained from Applet:
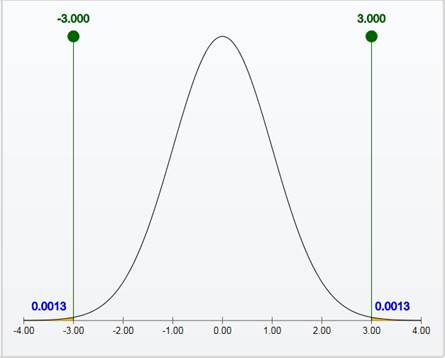
From the Applet output, the area to the left of −3 is 0.0013 and the area to right of 3 is 0.0013.
The formula to find the area within 3 standard deviations of the mean is,
Thus, the area within 3 standard deviations of the mean is 0.9974. That is, about 99.7% of the observations fall within
From the 68-95-99.7 rule, the area within 3 standard deviations of the mean is about 99.7%.
Justification:
The result of the area within 2 standard deviations of the mean is approximately same by using the applet and the 68-95-99.7 rule and also the result of the area within 3 standard deviations of the mean is approximately same by using the applet and the 68-95-99.7 rule.
Want to see more full solutions like this?
Chapter 3 Solutions
Bundle: Basic Practice of Statistics 7e & LaunchPad (Twelve Month Access)


 MATLAB: An Introduction with ApplicationsStatisticsISBN:9781119256830Author:Amos GilatPublisher:John Wiley & Sons Inc
 Probability and Statistics for Engineering and th...StatisticsISBN:9781305251809Author:Jay L. DevorePublisher:Cengage Learning
 Statistics for The Behavioral Sciences (MindTap C...StatisticsISBN:9781305504912Author:Frederick J Gravetter, Larry B. WallnauPublisher:Cengage Learning
 Elementary Statistics: Picturing the World (7th E...StatisticsISBN:9780134683416Author:Ron Larson, Betsy FarberPublisher:PEARSON
 The Basic Practice of StatisticsStatisticsISBN:9781319042578Author:David S. Moore, William I. Notz, Michael A. FlignerPublisher:W. H. Freeman
 Introduction to the Practice of StatisticsStatisticsISBN:9781319013387Author:David S. Moore, George P. McCabe, Bruce A. CraigPublisher:W. H. Freeman