
Principles of Microeconomics, Student Value Edition Plus MyLab Economics with Pearson eText -- Access Card Package (12th Edition)
12th Edition
ISBN: 9780134421315
Author: Karl E. Case, Ray C. Fair, Sharon E. Oster
Publisher: PEARSON
expand_more
expand_more
format_list_bulleted
Videos
Textbook Question
Chapter 3, Problem 5.11P
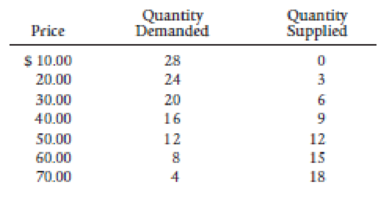
The following table represents the market for solar wireless keyboards. Plot this data on a supply and demand graph and identify the
Expert Solution & Answer
Want to see the full answer?
Check out a sample textbook solution
Students have asked these similar questions
The following table represents the market for solar wireless
keyboards. Plot this data on a supply and demand graph
and identify the equilibrium price and quantity. Explain
what would happen if the market price is set at $60, and
show this on the graph. Explain what would happen if the
market price is set at $30, and show this on the graph.
Price
$ 10.00
20.00
30.00
40.00
50.00
60.00
70.00
Quantity
Demanded
28
24
20
16
12
8
4
Quantity
Supplied
0
3
6
9
12
15
18
जी
The demand and supply curves for a product are given by:
Qd = 600 - 2P
Qs = 300 + 4P
Find the equilibrium price and the equilibrium quantity. Carefully draw a graph to illustrate your
answer. Make sure to write out the intercepts. Show the equilibrium price and the equilibrium
quantity on your graph.
Draw a demand and supply graph, label all axes, and the equilibrium price and quantity.
Once you have done this draw what would happen if there was a decrease in the
number of buyers in the market
Chapter 3 Solutions
Principles of Microeconomics, Student Value Edition Plus MyLab Economics with Pearson eText -- Access Card Package (12th Edition)
Knowledge Booster


Learn more about
Need a deep-dive on the concept behind this application? Look no further. Learn more about this topic, economics and related others by exploring similar questions and additional content below.Similar questions
- How does the equilibrium price and quantity change when here are bad rumors about a product? Are there any changes or none? Provide a graph of your answerarrow_forwardDraw the supply and demand graph in equilibrium for a single market. Identify the equilibrium price and quantity. Make sure to label the axis as well as the curves.arrow_forwardDirections Post your initial response by Thursday & reply to 2 other students by Saturday. You have been learning about the factors that affect supply and demand as well as how price affects the quantity demanded or supplied. In this week's discussion board, you will be running a computer printer shop. You only produce and sell various types of printers which you make using various inputs. Below is a list of economic conditions you are currently experiencing: 1. You implemented new technology to build the printers. 2. You experienced a decrease in the price of print ink cartridges a complement for printers. 3. You increase the price of printers. 4. The price of plastic to make the printers decreases, 5. A new eco-friendly trend as emerged and your printer is rated #1 in eco- friendliness. Using the 4-step process in described in chapter 3 complete the following for each scenario: 1. Step 1-Draw a demand curve and supply curve before the economic change took place label as…arrow_forward
- The table on the right shows the demand and supply schedules for sandwichesarrow_forwardDraw a supply and demand graph for new cars. Show the impact that the 2008-09 recession (with the decrease in consumer income) had on the market for cars. You can show this best by shifting one of the curves. What happens to the price and quantity of new cars?arrow_forwardDraw a graph that depicts what has happened to our demand and supply curves in the market for OceanSpray juice, including our new equilibrium price and quantity.arrow_forward
- What happens to the equilibrium price and quantity when demand decreases and at the same time supply increases, but the demand shift is relatively larger than the supply shift? Plot the graph to show your answer.arrow_forwardDraw a supply and demand graph showing an equilibrium price of $50 and an equilibrium quantity of 200 units. Explain what would happen if the selling price was $75, and illustrate this on the graph. Explain what would happen if the selling price was $25, and illustrate this on the graph. Be sure to label each axis and curve on the graph. Note:- Do not provide handwritten solution. Maintain accuracy and quality in your answer. Take care of plagiarism. Answer completely. You will get up vote for sure.arrow_forwardHow will an increase in population growth in Rock Hill affect the equilibrium price and quantities of residential houses? Plot a chart with supply and demand curves to illustrate your idea.arrow_forward
- Suppose Jermaine and Tim are the only people in the market. The curve DJ is Jermaine's demand curve and the curve DT is Tim's demand curve. Draw the market demand curve and label it. (If you plot any points to help you draw the curve, you must erase the points before submitting the Problem Set). Price (dollars per bag) 6.00 5.00- 4.00- 3.00- 2.00- 1.00 0.00+ 0 DJ 1 2 3 4 5 6 7 Quantity (bags per month) 8 Q 6.00 5.00- 4.00- 3.00- 2.00 1.00 0.00+ Price (dollars per bag) DT 0 1 2 3 4 5 6 7 8 9 10 11 12 Quantity (bags per month) 6.00 5.00 4.00- 3.00- 2.00- 1.00- 0.00+ 0 Price (dollars per bag) -~ 2 4 to 6 8 10 12 14 16 Quantity (bags per month) 18 20 Q Qarrow_forwardCoffee bean merchants notice that coffee prices are at a historic low today, but they expect the price of coffee beans to increase in the next six months. How will the situation affect the supply of coffee beans on the market today and next six month? Draw the graph to show this situation.arrow_forwardConsider the supply and demand curves for taxi rides in the attached graph. At the equilibrium price of____ the quantity observed in the market will be____million miles.arrow_forward
arrow_back_ios
arrow_forward_ios
Recommended textbooks for you
 Exploring EconomicsEconomicsISBN:9781544336329Author:Robert L. SextonPublisher:SAGE Publications, Inc
 Managerial Economics: A Problem Solving ApproachEconomicsISBN:9781337106665Author:Luke M. Froeb, Brian T. McCann, Michael R. Ward, Mike ShorPublisher:Cengage Learning

 Economics (MindTap Course List)EconomicsISBN:9781337617383Author:Roger A. ArnoldPublisher:Cengage Learning
 Economics Today and Tomorrow, Student EditionEconomicsISBN:9780078747663Author:McGraw-HillPublisher:Glencoe/McGraw-Hill School Pub Co
Exploring Economics
Economics
ISBN:9781544336329
Author:Robert L. Sexton
Publisher:SAGE Publications, Inc
Managerial Economics: A Problem Solving Approach
Economics
ISBN:9781337106665
Author:Luke M. Froeb, Brian T. McCann, Michael R. Ward, Mike Shor
Publisher:Cengage Learning
Economics (MindTap Course List)
Economics
ISBN:9781337617383
Author:Roger A. Arnold
Publisher:Cengage Learning
Economics Today and Tomorrow, Student Edition
Economics
ISBN:9780078747663
Author:McGraw-Hill
Publisher:Glencoe/McGraw-Hill School Pub Co
Difference between Renewable and Nonrenewable Resources; Author: MooMooMath and Science;https://www.youtube.com/watch?v=PLBK1ux5b7U;License: Standard Youtube License