
Concept explainers
Videos
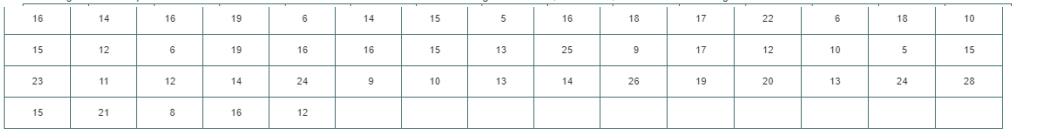
Call centers today play an important role in managing day-to-day business communications with customers. It's important, therefore to monitor a comprehensive set of metrics. which can help businesses understand the overall performance of a call center. One key metric for measuring overall call center performance is service level which is defined as the percentage of calls answered by a human agent within a specified number of seconds. The file ServiceLevel contains the following data for time. in seconds: to answer 50 Incoming calls to a financial services call center:
a. Compute the mean,
b. List the five-number summary.
c. Construct a boxplot and describe its shape.
d. What can you conclude about call center performance if the service level target is set as ‘75% of calls answered in under 20 seconds?’
Want to see the full answer?
Check out a sample textbook solution
Chapter 3 Solutions
EBK BASIC BUSINESS STATISTICS


- Find the mean hourly cost when the cell phone described above is used for 240 minutes.arrow_forwardIn 2011 home prices and mortgage rates dropped so low that in a number of cities the monthly cost of owning a home was less expensive than renting. The following data show the average asking rent for 10 markets and the monthly mortgage on the median priced home (including taxes and insurance) for 10 cities where the average monthly mortgage payment was less than the average asking rent (The Wall Street Journal, November 26–27, 2011).Click on the datafile logo to reference the data. Enter negative values as negative numbers. a. Develop the estimated regression equation that can be used to predict the monthly mortgage given the average asking rent (to 2 decimals).The regression equation is:Mortgage ($) = + Rent ($)arrow_forwardSpring is a peak time for selling houses. Suppose the data below contains the selling price, number of bathrooms, square footage, and number of bedrooms of 26 homes sold in Ft. Thomas, Kentucky, in spring 2018. Selling Price Baths Sq Ft Selling Price 160,000 170,000 178,000 182,500 195,100 212,500 245,900 250,000 255,000 258,000 267,000 268,000 275,000 1.5 1,786 2 1,768 1 1,219 1 1,578 1.5 1,125 2 1,196 2 2,128 N W 3 2 1,280 1,596 3.5 2,374 2.5 2,439 2 1,470 2 1,688 Beds 3 3 3 2 3 2 3 3 3 4 3 4 4 295,000 325,000 325,000 328,400 331,000 344,500 365,000 385,000 395,000 399,000 430,000 430,000 454,000 Baths Sq Ft 2.5 1,860 3 2,056 3.5 2,776 2 1,408 1.5 1,972 2.5 1,736 2.5 1,990 2.5 3,640 2.5 1,928 2 2,108 2 2,462 2 2,615 3.5 3,700 Beds 3 4 4 4 3 3 4 4 4 3 4 4 4 Consider the estimated regression equation we developed that can be used to predict the selling price given the number of bathrooms, square footage, and number of bedrooms in the house. (x, denotes number of bathrooms, x₂ denotes…arrow_forward
- Google has changed its strategy with regard to how much and over which media it invests in advertising. The following table shows Google's marketing budget in millions of dollars for 2008 and 2011 (The Wall Street Journal, March 27, 2012). 2008 2011 Internet $26.0 $123.3 Newspaper, etc. $4.0 $20.7 Television $0.0 $69.3 a. Select a side-by-side bar chart with year as the variable on the horizontal axis.arrow_forwarda. Call centers today play an important role in managing day-to-day business communications with customers. It's important, therefore, to monitor a comprehensive set of metrics, which can help businesses understand the overall performance of a call center. One key metric for measuring overall call center performance is service level which is defined as the percentage of calls answered by a human agent within a specified number of seconds. The time, in seconds, to answer 10 incoming calls to a financial services call center are given below.: 16 14 16 19 6 15 5 6 9 At the 5% level of significance, does this sample show that on average the calls incoming to this call center are answered within 10 seconds. State the null and the alternative hypotheses. What is your conclusion? 14arrow_forwardThe average number of minutes Americans commute to work is 27.7 minutes (Sterling's Best Places, April 13, 2012). The average commute time in minutes for 48 cities are as follows: Click on the datafile logo to reference the data. DATA file Albuquerque Atlanta Austin Baltimore Boston Charlotte Chicago Cincinnati Cleveland Columbus Dallas Denver Detroit El Paso Fresno Indianapolis 23.3 28.3 24.6 32.1 31.7 25.8 38.1 24.9 26.8 23.4 28.5 28.1 29.3 24.4 23.0 24.8 Jacksonville Kansas City Las Vegas Little Rock Los Angeles Louisville Memphis Miami Milwaukee Minneapolis Nashville New Orleans New York Oklahoma City Orlando Philadelphia 26.2 Phoenix 23.4 Pittsburgh Portland 28.4 20.1 32.2 21.4 23.8 30.7 24.8 23.6 25.3 31.7 43.8 22.0 27.1 34.2 Providence Richmond c. What is the mode for these 48 cities? Select your answer - Sacramento Salt Lake City San Antonio San Diego San Francisco San Jose Seattle St. Louis Tucson Tulsa Washington, D.C. 28.3 25.0 26.4 23.6 23.4 25.8 20.2 26.1 24.8 32.6 28.5…arrow_forward
- The Toyota Camry is one of the best-selling cars in North America. The cost of a previously owned Camry depends on many factors, including the model year, mileage, and condition. To investigate the relationship between the car's mileage and the sales price for Camrys, the following data show the mileage and sale price for 19 sales (PriceHub web site, February 24, 2012). DATA file Miles (1,000s) Price ($1,000s) 22 16.2 29 16.0 36 13.8 47 11.5 63 12.5 77 12.9 73 11.2 87 13.0 92 11.8 101 10.8 110 8.3 28 12.5 59 11.1 68 15.0 68 12.2 91 13.0 42 15.6 65 12.7 110 8.3arrow_forwardSouthwest Airlines had 81.1 million domestic boardings in a recent year, followed by Delta Airlines with 79.4 million, American Airlines with 72.6 million, United Airlines with 56.3 million, Northwest Airlines with 43.3 million, US Airways with 37.8 million, and Continental Airlines with 31.5 million, according to T-100 Domestic Market. Construct a pie chart to depict this information. List down the variable of the above data. Describe whether each variable are qualitative or quantitative data? Explain your answer. Describe the level of measurement for the variables. Explain your answer.arrow_forwardOn December 17, 2007 baseball writer John Hickey wrote an article for the Seattle P-I about increases to ticket prices for Seattle Mariners games during the 2008 season. The article included a data set that listed the average ticket price for each MLB team, the league in which the team plays (AL or NL), the number of wins during the 2007 season and the cost per win (in dollars). The data for the 16 National League teams are shown below. league price wins cost/win team Arizona Diamondbacks NL 19.68 90 35.40 Atlanta Braves NL 17.07 84 32.89 Chicago Cubs NL 34.30 85 65.33 cincinnati Reds NL 17.90 72 40.32 Colorado Rockies NL 14.72 90 26.67 Florida Marlins NL 16.70 71 38.13 Houston Astros NL 26.66 73 59.11 Los Angeles Dodgers 20.09 82 34.64 NL Milwaukee Brewers NL 18.11 83 35.37 N.Y. Mets NL 25.28 88 46.56 Philadelphia Phillies 26.73 89 48.69 NL Pittsburgh Pirates NL 17.08 68 40.67 San Diego Padres NL 20.83 89 38.15 San Francisco Giants NL 24.53 71 56.00 St. Louis Cardinals NL 29.78 78…arrow_forward
- Total revenue for a soda in January 2011 was $4,342,262, and total revenue in January 2013 was $4,429,964. See the data below. The soda company is requesting your help as manager to understand how price increases are affecting the quantity of sodas sold. Create a table with the descriptive statistics of the number of sodas sold in the two years, as well as an explanation of the descriptive statistics: What are some of the key aspects of the descriptive statistics that help you tell a story about the 2 years in sodas sold. Run a regression where you explain how price changes are affecting the quantity of sodas sold. Include an explanation of the coefficients as well as an explanation of the t-statistics, the intercept, the R-Squared, and the F-Statistic. Explain managerial recommendations to the soda company on how can you increase the revenue.arrow_forwardIf an administrator at a regional hospital wanted to organize the following data, which chart/graph would they select, and why: a. Inpatient mortality rate (data on how many inpatients have died while in the hospital's care prior to being discharged). Sorted by first-listed diagnosis. b. Average revenue generated per physician. Sorted by physician. c. Percent of admitted patients with overnight stays compared to industry average.arrow_forwardWhich of the following would be the least helpful type of data to a car manufacturer when making business decisions? Employment data Competitor data Economic data School attendance data Financial dataarrow_forward
 Glencoe Algebra 1, Student Edition, 9780079039897...AlgebraISBN:9780079039897Author:CarterPublisher:McGraw Hill
 Big Ideas Math A Bridge To Success Algebra 1: Stu...AlgebraISBN:9781680331141Author:HOUGHTON MIFFLIN HARCOURTPublisher:Houghton Mifflin Harcourt
 Holt Mcdougal Larson Pre-algebra: Student Edition...AlgebraISBN:9780547587776Author:HOLT MCDOUGALPublisher:HOLT MCDOUGAL
 College Algebra (MindTap Course List)AlgebraISBN:9781305652231Author:R. David Gustafson, Jeff HughesPublisher:Cengage Learning
 Functions and Change: A Modeling Approach to Coll...AlgebraISBN:9781337111348Author:Bruce Crauder, Benny Evans, Alan NoellPublisher:Cengage Learning