Engineering Economy
16th Edition
ISBN: 9780133582819
Author: Sullivan
Publisher: DGTL BNCOM
expand_more
expand_more
format_list_bulleted
Videos
Textbook Question
Chapter 3, Problem 8P
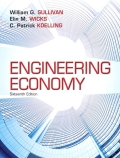
Prepare a composite (weighted) index for housing construction costs in 2014, using the following data: (3.3)
Expert Solution & Answer

Trending nowThis is a popular solution!

Students have asked these similar questions
This is an exercise. The cost of all the raw materials increased by 12% from the year 2017 to 2019. Find the composite Index in the year 2019 based on the year 2015.
Every year, there is some form of construction work going on at UF's campus. In January
2018, bids were opened for a new building on campus for UFPD. The bid/construction value of
the building was set at $5 Million. Another building of similar structure and purpose is planned
with a bid opening in January 2023. What is the expected bid for the new building?
It is given that in January 2000, the Florida Construction Cost Index had a value of 5550, while in
January 2018, that value was 8000. You can use these price indices to calculate an average
inflation in construction costs.
You will want to copy the table below into Excel (or enter by hand). Then in Excel
compute the 3 production indexes for aluminum, fertilizer, and lumber with time
period 1 as the base period. You will use these index values to answer the questions
in this homework set.
Quantity Quantity Quantity
Time Period Aluminum Fertilizer Lumber
2
3
4
525
575
500
625
600
1033
57 10,000
62
9,500
68 11,000
74 10,000
81
12,000
Setting time period 1 as the base period, aluminum production index has value of
in time period 3. (Your answer may differ slightly from provided answers due
to rounding, but one answer will be much closer.)
Chapter 3 Solutions
Engineering Economy
Ch. 3 - Prob. 1PCh. 3 - Prob. 2PCh. 3 - Prob. 3PCh. 3 - Prob. 4PCh. 3 - Prob. 5PCh. 3 - Prob. 6PCh. 3 - Prob. 7PCh. 3 - Prepare a composite (weighted) index for housing...Ch. 3 - Prepare a composite (weighted) index for housing...Ch. 3 - Prob. 10P
Ch. 3 - Prob. 11PCh. 3 - Prob. 12PCh. 3 - Prob. 13PCh. 3 - Prob. 14PCh. 3 - Prob. 15PCh. 3 - A biotech firm is considering abandoning its old...Ch. 3 - Prob. 17PCh. 3 - Prob. 18PCh. 3 - Prob. 19PCh. 3 - Prob. 20PCh. 3 - Prob. 21PCh. 3 - Prob. 22PCh. 3 - Prob. 23PCh. 3 - Prob. 24PCh. 3 - Prob. 25PCh. 3 - Prob. 26PCh. 3 - Prob. 28SECh. 3 - Prob. 31CSCh. 3 - Prob. 32CSCh. 3 - Prob. 36FECh. 3 - Prob. 37FECh. 3 - Prob. 38FECh. 3 - Prob. 39FECh. 3 - Prob. 40FECh. 3 - Prob. 41FE
Additional Business Textbook Solutions
Find more solutions based on key concepts
If a 3-percent increase in the price of corn flakes causes a 6-percent decline in the quantity demanded, what i...
Microeconomics (9th Edition) (Pearson Series in Economics)
Determine the price elasticity of demand if, in response to an increase in price of 10 percent, quantity demand...
Microeconomics
A case study in this chapter discusses the federal minimum-wage law. a. Suppose the minimum wage is above the e...
Principles of Economics, 7th Edition (MindTap Course List)
Knowledge Booster


Learn more about
Need a deep-dive on the concept behind this application? Look no further. Learn more about this topic, economics and related others by exploring similar questions and additional content below.Similar questions
- Computing levels: Suppose xt grows at 2% per year and yt grows at 5% peryear, with x0 = 2 and y0 = 1. Calculate the numerical values of zt for t = 0,t = 1, t = 2, t = 10, t = 17, and t = 35 for the following cases:(a) z = x(b) z = y(c) z = x3/4y 1/4arrow_forwardHomeowner Henry is building a fireplace for his house. The fireplace will require 2500 bricks. (a) If the cost of a Chimney Brick in 2007 was $2.10, calculate the material cost of Henry’s project in 2020. The Chimney Brick Index (CBI) was 442 in 2007 and is expected to be 651 in 2020. (b) Estimate the material cost of a similar fireplace to be built in the year 2023. What assumption did you make?arrow_forwardAn arena in Winnipeg cost $ 4.7 million in 2005. Estimate the cost of building a similar arena in Vancouver. Construction costs inVancouver are believed to be 31% higher than Winnipeg. The all-items Consumer Price Index (CPI) for 2005 in Canada was 107,while the latest available CPI is 137.3.arrow_forward
- . The manager of Petro North gasoline service station wants to forecast the demand for unleaded gasoline next month so that the proper number of gallons can be ordered from the distributor. The manager has accumulated the sales data and forecast accuracy measures during the past 10 months, which are shown in the table below. Fill all blank spaces in the table labeled a through f. Month Feb Mar Apr May Jun Jul Aug Sep Oct Nov 3-month Simple Moving Average N/A N/A N/A 1310.00 1340.00 1443.33 1566.67 1800.00 a 1673.33 Sales (in gallons) 1130 1360 1440 b 1670 1810 1920 1630 1470 1510 MAD N/A N/A N/A 90.00 210.00 262.22 С 262.00 271.11 255.71 MAPD N/A N/A N/A 0.074 d 0.167 0.172 0.159 0.167 0.159 MSE N/A N/A N/A 8100 58500 e 94072 81038 84245 76021 CE N/A N/A N/A -90 240.00 606.67 960.00 790.00 f 310.00arrow_forward7 The sum of squared errors (SSE) is, a 177,051.7 b 170,242.0 c 163,694.2 d 157,398.3arrow_forwardA certain index for the cost of purchasing and installing utility boilers is keyed to 1988, where its baseline value was arbitrarily set at 100. Company XYZ installed a 50,000-lb/hour boiler for $525,000 in 2000 when the index had a value of 468. This same company must install another boiler of the same size in 2017. The index in 2017 is 542. What is the approximate cost of the new boiler?arrow_forward
- The following two equations were estimated using the data in MEAPSINGLE. The key explanatory variable is lexppp, the log of expenditures per student at the school level. math4 = 24.49 + 9.01 lexpp – 422 free – .752 Imedinc – .274 pctsgle (.071) (59.24) (4.04) n = 229, R² = .472, R² (5.358) (.161) 462. 149.38 + 1.93 lexppp – .060 free – 10.78 Imedinc – .397 pctsgle + .667 read4 (3.76) math4 (41.70) (2.82) (.054) (.111) (.042) n = 229, R = .749, R = .743. (i) If you are a policy maker trying to estimate the causal effect of per-student spending on math test performance, explain why the first equation is more relevant than the second. What is the estimated effect of a 10% increase in expenditures per student? (ii) Does adding read4 to the regression have strange effects on coefficients and statistical signifi- cance other than Brexppp? (iii) How would you explain to someone with only basic knowledge of regression why, in this case, you prefer the equation with the smaller adjusted…arrow_forwardA company produces and sells luxury goods and is able to control the demand for the product by varying the selling price. The relationship between price and demand is found to be: p=10-(42/D^2)+2Dwhere p is the price per unit in million dollars and D is the demand per year. The company is seeking to maximize its profit. The fixed cost is $59 million per year and the variable cost is $25 million per unit. The production capacity is 42 units per year, and the company produces at least 1 unit per month.a) Derive how to find the number of units that should be produced annually to maximize profit.b) What is the maximum profit per year?c) What is the annual breakeven point?d)What is the company’s range of profitable output per year?arrow_forwardA manufacturing company produced 7200 units that sold for OMR 93600. The total variable costs for the units produced were OMR 68400 and the fixed costs were OMR 34440. The break-even point in sales value is OMR (................). (Write the number only) Answer:arrow_forward
- A company produces and sells luxury goods and is able to control the demand for the product by varying the selling price. The relationship between price and demand is found to be: p=10-(42/D^2)+2Dwhere p is the price per unit in million dollars and D is the demand per year. The company is seeking to maximize its profit. The fixed cost is $59 million per year and the variable cost is $25 million per unit. The production capacity is 42 units per year, and the company produces at least 1 unit per month. 1) What is the company’s range of profitable output per year?arrow_forwardSolve for x for the following equation: 4ln(3x-8) = 60arrow_forwardThe inventory footnote from Deere & Company's 2010 10-K follows ($ millions). 15. INVENTORIES Most inventories owned by Deere & Company and its US equipment subsidiaries are valued at cost, on the "last-in, first- out" (LIFO) basis. Remaining inventories are generally valued at the lower of cost, on the "first-in, first-out" (FIFO) basis. Remaining inventories are generally valued at the lower of cost, on the "first-in, first-out" (FIFO) basis, or market. The value of gross inventories on the LIFO basis represented 59 percent of worldwide gross inventories at FIFO value on October 31, 2013 and 2012, respectively. If all inventories had been valued on a FIFO basis, estimated inventories by major classification at October 31 in millions of dollars would have been as follows: 2013 2012 Raw materials and supplies $2,402 $1,880 Work-in-process 966 774 Finished goods and parts 5,554 4,874 Total FIFO value 8,922 7,528 Less adjustment to LIFO value (2,796) (2,734) Inventories $6,126 $4,794 We…arrow_forward
arrow_back_ios
SEE MORE QUESTIONS
arrow_forward_ios
Recommended textbooks for you

 Principles of Economics (12th Edition)EconomicsISBN:9780134078779Author:Karl E. Case, Ray C. Fair, Sharon E. OsterPublisher:PEARSON
 Engineering Economy (17th Edition)EconomicsISBN:9780134870069Author:William G. Sullivan, Elin M. Wicks, C. Patrick KoellingPublisher:PEARSON
 Principles of Economics (MindTap Course List)EconomicsISBN:9781305585126Author:N. Gregory MankiwPublisher:Cengage Learning
 Managerial Economics: A Problem Solving ApproachEconomicsISBN:9781337106665Author:Luke M. Froeb, Brian T. McCann, Michael R. Ward, Mike ShorPublisher:Cengage Learning
 Managerial Economics & Business Strategy (Mcgraw-...EconomicsISBN:9781259290619Author:Michael Baye, Jeff PrincePublisher:McGraw-Hill Education
Principles of Economics (12th Edition)
Economics
ISBN:9780134078779
Author:Karl E. Case, Ray C. Fair, Sharon E. Oster
Publisher:PEARSON
Engineering Economy (17th Edition)
Economics
ISBN:9780134870069
Author:William G. Sullivan, Elin M. Wicks, C. Patrick Koelling
Publisher:PEARSON
Principles of Economics (MindTap Course List)
Economics
ISBN:9781305585126
Author:N. Gregory Mankiw
Publisher:Cengage Learning
Managerial Economics: A Problem Solving Approach
Economics
ISBN:9781337106665
Author:Luke M. Froeb, Brian T. McCann, Michael R. Ward, Mike Shor
Publisher:Cengage Learning
Managerial Economics & Business Strategy (Mcgraw-...
Economics
ISBN:9781259290619
Author:Michael Baye, Jeff Prince
Publisher:McGraw-Hill Education
Difference between Renewable and Nonrenewable Resources; Author: MooMooMath and Science;https://www.youtube.com/watch?v=PLBK1ux5b7U;License: Standard Youtube License