
Concept explainers
Videos
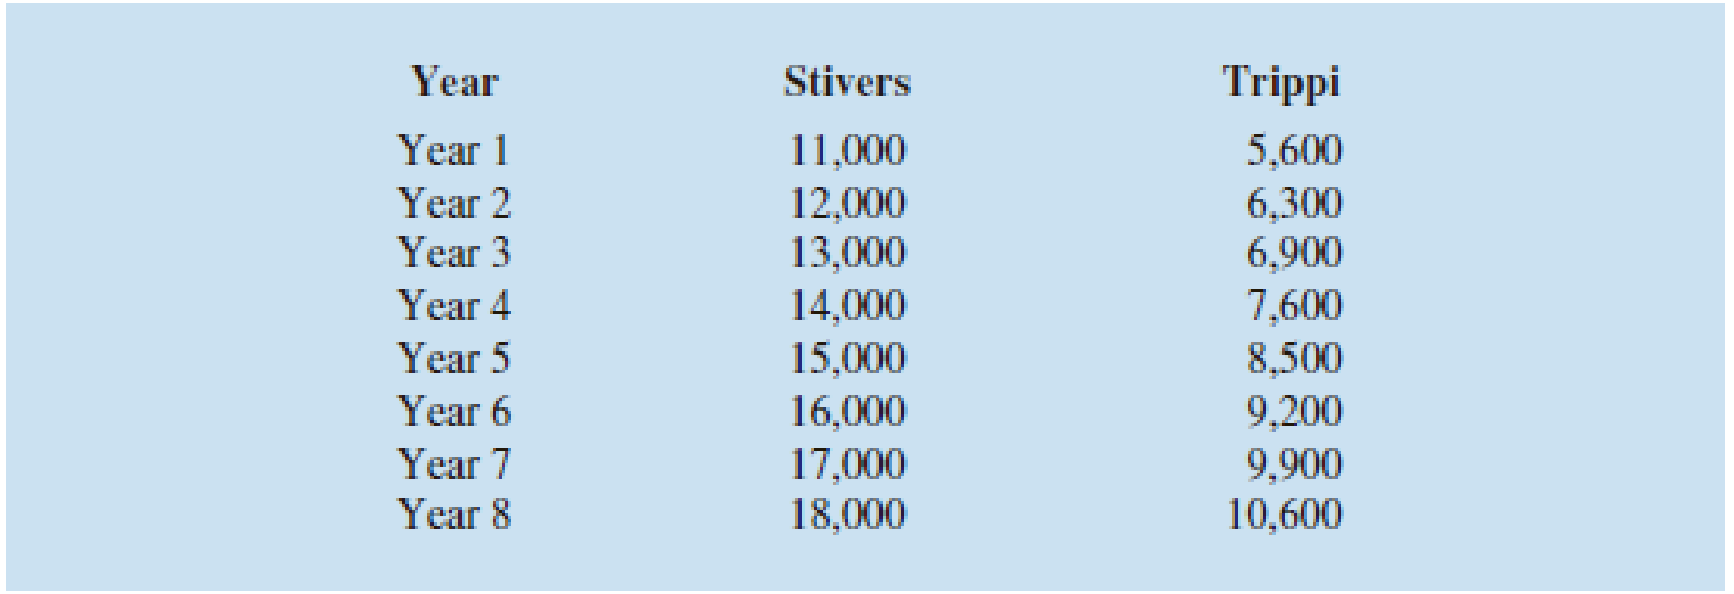
Suppose that at the beginning of Year 1 you invested $10,000 in the Stivers mutual fund and $5000 in the Trippi mutual fund. The value of each investment at the end of each subsequent year is provided in the table below. Which mutual fund performed better?
Identify the mutual fund that performed better.
Answer to Problem 20E
The Trippi mutual fund performed better than Stivers.
Explanation of Solution
Calculation:
In the Stivers mutual fund, $10,000 is invested at the beginning of Year 1 and in Trippi mutual fund, $5,000 is invested at the beginning of Year 1. The given table represents the value of each investment at the end of each subsequent year.
The geometric mean is often used for finding the mean growth rate.
The mean growth factor over these eight periods is:
Where,
The growing factor of each year can be obtained by dividing the value of end of year by the previous year value.
The growth factor of Stivers for the year 1 can be obtained as follows:
The growth factor of Trippi for the year 1 can be obtained as follows:
Similarly the growth actor for remaining years can be obtained as shown in the table given below:
| Year | Stivers | Trippi | ||
| End of Year Value | Growth Factor | End of Year Value | Growth Factor | |
| 1 | $11,000 | 1.100 | $5,600 | 1.120 |
| 2 | $12,000 | 1.091 | $6,300 | 1.125 |
| 3 | $13,000 | 1.083 | $6,900 | 1.095 |
| 4 | $14,000 | 1.077 | $7,600 | 1.101 |
| 5 | $15,000 | 1.071 | $8,500 | 1.118 |
| 6 | $16,000 | 1.067 | $9,200 | 1.082 |
| 7 | $17,000 | 1.063 | $9,900 | 1.076 |
| 8 | $18,000 | 1.059 | $10,600 | 1.071 |
For the Stivers mutual fund:
The balance at the end of the year 8 is the initial investment times the product of all 8 growth factors.
That is,
Substitute
Thus, the mean annual return for the Stivers mutual fund is
For the Trippi mutual fund:
The balance at the end of the year 8 is the initial investment times the product of all 8 growth factors.
That is,
Substitute
Thus, the mean annual return for the Trippi mutual fund is
The annual return earned by the Trippi mutual fund is 9.8% and by the Stivers mutual fund is 7.6%. Hence, the annual return earned by the Tripp mutual fund is more than that of Stivers mutual fund.
Thus, it can be concluded that the Trippi mutual fund performed better than Stivers.
Want to see more full solutions like this?
Chapter 3 Solutions
Mindtapv2.0 For Anderson/sweeney/williams/camm/cochran's Modern Business Statistics With Microsoft Excel, 1 Term Printed Access Card (mindtap Course List)


- complete the income statement for Thom-Pierre consultants for the year ended 31 december. Thom-Pierre Consultants (TPC) Quarterly Schedule of Revenue For the year December 31, 2018 QTR1 QTR2 QTR3 QTR4 2018 Sales 290000 320000 320000 490000 1,420,000 Interest 102500 175000 180000 54000 511,500 Investment Income 13000 9500 10000 20000 52,500 Other 16000 25000 19500 29000 89,500 Total 421,500 529,500 529,500 593,000 2,073,500 Thom-Pierre Consultants (TPC) Tax Rate COMPARATIVE INCOME STATEMENT 30% for years ended 31 December 2018 2019 Revenues and gains *Sales revenue *Interest revenue *Investment Income *Other revenue Total revenue and gains Expenses and losses…arrow_forwardFor short listing of the candidates for a job in a company in different sections based on the cumulative percentage of the following fields. • I f cumulative percentage is more than 80% then hire in HR department. • If cumulative percentage is less than 80% and greater than 70% then hire in accounts department. • If cumulative percentage is less than 70% and greater than 60% then hire in sales department. • f cumulative percentage is less than 60% and greater than 50% then hire in helping staff. The cumulative percentage will be calculated as 60% of the marks obtained in test conducted by the company and 40% of obtained marks in interview. Total marks for the test and interview is 200 each. Write a computer program to construct a function with name "Selection to calculate the cumulative percentage and then display the message in which section the candidate is selected.arrow_forwardQ4 There are 9 workers for ASH Development Sdn. Bhd. Unfortunately, there are only 4 rooms available for these workers. Every week, a worker name is randomly selected to do odd jobs for the company. When a worker has been selected randomly, a these rooms are full. Based on Figure Q4, worker's ID number 0 (Umar) is randomly selected for the first week, and the 4 boxes represent 4 rooms for as shown in Table Q4. room needs to be vacated if workers. Table Q4 Worker's ID Worker's Name Umar 1. Lukman Arif Yusuf Anas Muadz Aleef Hafiz 8. Amir 9. Taufik WI 4 6 2 9. 4 1 3 8 D R2 R3 R4 W W W1 w1 Wi w1 W1 w1 w1 wi Wi W1 2 3 4 56 78 9 1 2 3 4 5 6 8 9 Figure Q4 Investigate the number of page faults occur by illustrating the way how the room is managed using the list of weekly random selection of workers as shown in Figure Q4 using the following algorithms: (a) Optimal Page Replacement (OPR) replacement algorithm 2. RRRarrow_forward
- The following data give the starting salary for students who recently graduated from a local university and accepted jobs soon after graduation. The starting salary, grade-point average (GPA), and major (business or other) are provided. SALARY $29,500 $46,000 $39,800 $36,500 GPA 3.1 3.5 3.8 2.9 Major Other Business Business Other SALARY $42,000 $31,500 $36,200 GPA 3.4 2.1 2.5 Major Business Other Business Using a computer, develop a regression model that could be used to predict a starting salary based on GPA and major. Use this model to predict the starting salary for a business major with a GPA of 3.0. What does the model say about the starting salary for a business major compared to a non-business major? Do you believe this model is useful in predicting the starting salary? Justify your answer, using the information provided in the computer output.arrow_forwardCalculate the "Days on Market" in column L by finding the difference between Date Sold icokumn and Date Listed (column H) first. What is the average Sales Price for all the properties with 2or more bedrooms and more than 180 days on the market?arrow_forwardSQL Data Manipulation Database tables are: Hospital hospitalNo name city 1493 Cambridge St Boston capacity Cambridge Mount Sinai 2 East 101st St H117 600 H120 New York 700 ******** ******* ******* Doctor doctorNo salary hospitalNo specialty Cardiologist Neurologist name Robert Donald Xin Wang D201 180000 H117 D205 225000 H120 Patient | age phoneNo 617-482-5801 212-353-1463 patientNo name doctor P366 Arthur Gluck 72 D201 P351 Lisa Hershman 46 D205 ****arrow_forward
- Find those job categories whose maximum salary among the people hired after 1980 is more than 2500 Find the average salary of those employees whose name starts with J in each department Find the most recent employment among those hired before 1980 for each departmentarrow_forwardVacation days are based on status. Using the information in the lower table below, do a lookup in the upper table determine the amount of vacation time earned by each employee. Status Vacation Time Earned Full TIme 10 Part Time 7 Contract 0 Employees Status Vacation TIme Earned John Contract Jane Part Time Al Full TImearrow_forwardProblem List with Expected Results Problem 1 For all departments, display department number and the sum of all salaries for each department. Name the derived column SUM_SALARY. Result WORKDEPT SUM_SALARY A00 B01 C01 D11 D21 E01 E11 E21 128500.00 41250.00 90470.00 222100.00 150920.00 40175.00 104990.00 95310.00arrow_forward
- 1. Determine the total profit generated by sales to customer 1017. Note: Quantity should be reflected in total profit calculation.arrow_forward• Show all the different positions in the Staff table.• Show all the different branchNo in the Staff table.• Show all the different hotelNo in the Room table.arrow_forwardThe data in this table is as follows: Team Dragons Carp Bay Stars Marines Ham Fighters The latest scores from the Japanese Baseball League are in the table with schema Scores(Team, Opponent, RunsFor, RunsAgainst) Lions Tigers Swallows Giants Hawks Buffaloes O a. Hawks Opponent Tigers Swallows Giants Hawks Buffaloes O b. Dragons O c. Buffaloes O d. Giant Golden Eagles Dragons Carp Bay Stars Marincs Ham Fighters RunsFor 5 3 1 Bay Stars 6 3 Tigers Ham Fighters 5 1 8 4 2 RunsAgainst 3 6 Golden Eagles Lions 12 What is the result of executing the following query on this data? 6 1 3 6 12 5 4 2 5 1 8 Identify, in the list below, a row of the result. Marines SELECT Team, Opponent FROM Scores WHERE Team LIKE '% %' OR Opponent LIKE '_i%';arrow_forward
 Np Ms Office 365/Excel 2016 I NtermedComputer ScienceISBN:9781337508841Author:CareyPublisher:CengageCOMPREHENSIVE MICROSOFT OFFICE 365 EXCEComputer ScienceISBN:9780357392676Author:FREUND, StevenPublisher:CENGAGE L
 A Guide to SQLComputer ScienceISBN:9781111527273Author:Philip J. PrattPublisher:Course Technology Ptr
 Operations Research : Applications and AlgorithmsComputer ScienceISBN:9780534380588Author:Wayne L. WinstonPublisher:Brooks Cole