
Concept explainers
Videos
Developing a Linear Model from Data How many songs can an iPod hold? The following data represent the memory and the number of songs .
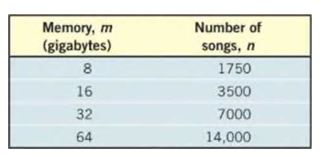
a. Plot the ordered pairs in a Cartesian plane.
b. Show that the number of songs is a linear function of memory .
c. Determine the linear function that describes the relation between and .
d. What is the implied domain of the linear function?
e. Graph the linear function in the Cartesian plane drawn in part (a).
f. Interpret the slope.
Want to see the full answer?
Check out a sample textbook solution
Chapter 3 Solutions
Precalculus Enhanced With Graphing Utilities With Mymathlab Package For Central Connecticut State University, 1/e
Additional Math Textbook Solutions
Glencoe Math Accelerated, Student Edition
University Calculus: Early Transcendentals (3rd Edition)
Single Variable Calculus: Early Transcendentals (2nd Edition) - Standalone book
University Calculus: Early Transcendentals (4th Edition)
Precalculus (10th Edition)
Precalculus


- High School Graduates The following table shows the number, in millions, graduating from high school in the United States in the given year. Year Number graduating in millions 1985 2.83 1987 2.65 1989 2.47 1991 2.29 a. By calculating difference, show that these data can be modeled using a linear function. b. What is the slope for the linear function modeling high school graduations? Explain in practical terms the meaning of the slope. c. Find a formula for a linear function that models these data. d. Express, using functional notation, the number graduating from high school in 1994, and then use your formula from part c to calculate that value.arrow_forwardDemand for Soft Drinks A convenience store manager notices that sales of soft drink are higher on hotter days, so he assembles the data in the table. (a) Make a scatter plot of the data. (b) Find and graph a linear function that models the data. (c) Use the model to predict soft drink sales if the temperature is 95Farrow_forwardTuition at American Public Universities This is a continuation of Exercise 6. The following table shows the average yearly in-state tuition and required fees, in dollars, charged by four-year American public universities in the school year ending in the given year. Date Average tuition 2012 8318 2013 8595 2014 8872 2015 9149 2016 9426 a. Show that these data can be modeled by a linear function, and find its formula. b. What is the slope for the linear function modeling tuition and required fees for public universities? c. What is the slope of the linear function modeling tuition and required fees for private universities? Note: See Exercise 6. d. Explain what the information in parts b and c tells you about the rate of increase in tuition in public versus private institutions. e. Which type of institution shows the larger percentage increase from 2015 to 2016? 6. Tuition at American Private Universities The following table shows the average yearly tuition and required fees, in dollars, charged by four-year American private nonprofit universities in the school year ending in the given year. Date Average tuition 2012 27, 870 2013 29, 004 2014 30, 138 2015 31, 272 2016 32, 406 a. Show that these data can be modeled by a linear function, and find its formula. b. Plot the data points and add the graph of the linear formula you found in part a. c. What prediction does this formula give for average tuition and fees at four-year American private nonprofit universities for the academic year ending in 2021?arrow_forward
- Sales Barnes & Noble had annual sales of $6.8 billion in 2013 and $6.1 billion in 2015. Use the Midpoint Formula to estimate the sales in 2014. Assume that the annual sales followed a linear pattern.arrow_forwardNeurology The average weight of a male child’s brain is 970 grams at age 1 and 1270 grams at age 3. (a) Assuming that the relationship between brain weight y and age t is linear, write a linear model for the data. (b) What is the slope and what does it tell you about brain weight? (c) Use your model to estimate the average brain weight at age 2. (d) Use your school’s library, the Internet, or some other reference source to find the actual average brain weight at age 2. How close was your estimate? (e) (d) Do you think your model could be used to determine the average brain weight of an adult? Explain.arrow_forwardMathematical Models In Exercises 9 and 10, (a) plot the actual data and the model of the same graph and (b) describe how closely the model represents the data. If the model does not closely represent the data, suggest another type of model that may be a better fit. The ordered pairs below give the revenues y (in billions of dollars) for Activision Blizzard, Inc., from 2008 through 2014. 2008,3.032012,4.862009,4.282013,4.582010,4.452014,4.412011,4.76 A model for the data is y=0.184t+2.32,8t14, where t represents the year, with t=8 corresponding to 2008.arrow_forward
- Price of Amazons Kindle The following table shows the price of Amazons Kindle 2 e-book reader. It is adapted from data available on the web. Here time is measured in months since February 2009, when the Kindle was launched. Time Price 0 349 5 299 10 249 15 199 a. By calculating differences, show that these data can be modeled using a linear function. b. Find a linear formula that models these data. Be careful about the sign of the slope. c. What price does your formula from part b project for January 2012 35 months after the Kindle was launched? Note: The web data were the basis for speculation that some day the Kindle would be free.arrow_forwardManufacturing Cost The manager of a furniture factory finds that it costs 2200 to produce 100 chairs in one day and 4800 to produce 300 chairs in one day. a Assuming that the relationship between cost and the number of chairs produced is linear, find a linear function C that models the cost of producing x chairs in one day. b Draw a graph of C. What is the slope of this line? c At what rate does the factorys cost increase for every additional chair produced?arrow_forward6. Tuition at American Private Universities The following table shows the average yearly tuition and required fees, in dollars, charged by four-year American private nonprofit universities in the school year ending in the given year. Date Average tuition 2012 27,870 2013 29,004 2014 30,138 2015 31,272 2016 32,406 a. Show that these data can be modeled by a linear function, and find its formula. b. Plot the data points and add the graph of the linear formula you found in part a. c. What prediction does this formula give for average tuition and fees at four-year American private nonprofit universities for the academic year ending in 2021?arrow_forward
 Functions and Change: A Modeling Approach to Coll...AlgebraISBN:9781337111348Author:Bruce Crauder, Benny Evans, Alan NoellPublisher:Cengage Learning
 Big Ideas Math A Bridge To Success Algebra 1: Stu...AlgebraISBN:9781680331141Author:HOUGHTON MIFFLIN HARCOURTPublisher:Houghton Mifflin Harcourt
 College AlgebraAlgebraISBN:9781305115545Author:James Stewart, Lothar Redlin, Saleem WatsonPublisher:Cengage Learning
 Holt Mcdougal Larson Pre-algebra: Student Edition...AlgebraISBN:9780547587776Author:HOLT MCDOUGALPublisher:HOLT MCDOUGAL
 Algebra and Trigonometry (MindTap Course List)AlgebraISBN:9781305071742Author:James Stewart, Lothar Redlin, Saleem WatsonPublisher:Cengage Learning