Concept explainers
Videos
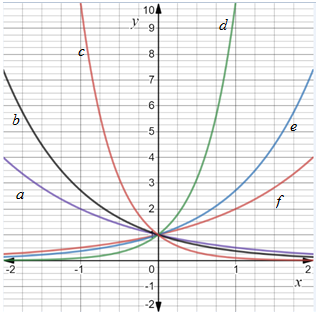
HOW DO YOU SEE IT? The figure shows the graphs of
Want to see the full answer?
Check out a sample textbook solution
Chapter 3 Solutions
Bundle: Precalculus, Loose-leaf Version, 10th + WebAssign Printed Access Card for Larson's Precalculus, 10th Edition, Single-Term


- Population Statistics The table shows the life expectancies of a child (at birth) in the United States for selected years from 1940 through 2010. A model for the life expectancy during this period is y=63.6+0.97t1+0.01t,0t70 Where y represents the life expectancy and t is the time in years, with t = 0 corresponding to 1940. (a) Use a graphing utility to graph the data from the table and the model in the same viewing window. How well does the model fit the data? Explain. (b) Determine the life expectancy in 1990 both graphically and algebraically. (c) Use the graph to determine the year when life expectancy was approximately 70.1. verify your answer algebraically. (d) Find the y-intercept of the graph of the model. What does it represent in the context of the problem? (e) Do you think this model can be used to predict the life expectancy of a child 50 years from now?arrow_forwardPopulation Statistics The table shows the life expectancies of a child (at birth) in the United States for selected years from 1940 through 2010. A model for the life expectancy during this period is y=63.6+0.97t1+0.01t,0r70 Where y represents the life expectancy and t is the time in years, with t=0 corresponding to 1940. (a) Use a graphing utility to graph the data from the table and the model in the same viewing window. How well does the model fit the data? Explain (b) Determine the life expectancy in 1990 both graphically and algebraically. (c) Use the graph to determine the year when life expectancy was approximately 70.1. Verify your answer algebraically. (d) Identify the y-intercept of the graph of the model. What does it represent in the context of the problem? (e) Do you think this model can be used to predict the life expectancy of a child 50 years from now? Explainarrow_forwardBiology A science class performs an experiment comparing the quantity of food consumed by a species of moth with the quantity of food supplied. The model for the experimental data is y=1.568x0.0016.360x+1, x0 where x is the quantity (in milligrams) of food supplied and y is the quantity (in milligrams) of food consumed. (a) Use a graphing utility to graph this model. (b) At what level of consumption will the moth become satiated?arrow_forward
- Functional Response: The amount C of food consumed in a day by a sheep is a function of the amount V of vegetation available, and a model is C=3V50+V, Here C is measured in pounds and V in pounds per acre. This relationship is called the functional response. a. Make a graph of C versus V. Include vegetation levels up to 1000 pounds per acre. b. Calculate C300 and explain in practical terms what your answer means. c. Is this graph concave up or concave down? Explain in practical terms what this means. d. From the graph, it should be apparent that there is a limit to the amount of food consumed as more and more vegetation is available. Find this limiting value of C.arrow_forwardFlood Control A river is 8 feet above its flood stage. The water is receding at a rate of 3 inches per hour. Write a mathematical model that shows the number of feet above flood stage after t hours. Assuming the water continually recedes at this rate, when will the river be 1 foot above its flood stage?arrow_forward
 Trigonometry (MindTap Course List)TrigonometryISBN:9781337278461Author:Ron LarsonPublisher:Cengage Learning
 Big Ideas Math A Bridge To Success Algebra 1: Stu...AlgebraISBN:9781680331141Author:HOUGHTON MIFFLIN HARCOURTPublisher:Houghton Mifflin Harcourt
 Algebra & Trigonometry with Analytic GeometryAlgebraISBN:9781133382119Author:SwokowskiPublisher:Cengage
 Functions and Change: A Modeling Approach to Coll...AlgebraISBN:9781337111348Author:Bruce Crauder, Benny Evans, Alan NoellPublisher:Cengage Learning