
Concept explainers
Videos
The bar graph shows the percentage of Americans who used cigarettes, by ethnicity, in 1985 and 2005. For each of the groups shown, cigarette use has been linearly decreasing. Use this information to solve Exercises 95–96.
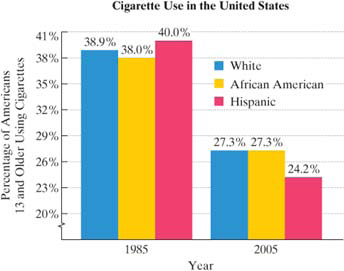
In this exercise, let x represent the number of years after 1985 and let y represent the percentage of Americans in one of the groups shown who used cigarettes.
Use the data points (0, 38) and (20, 27.3) to find the slope-intercept equation of the line that models the percentage Ot African Americans Who used cigarettes, y, x years after 1985. Round the value of the slope m to two decimal places.
Use the data points (O, 40) and (20, 24.2) to find the slope-intercept equation of the line that models the percentage of Hispanics who used cigarettes. y, x years after 1985
Use the models from parts (a) and (b) to find the year during which cigarette use was the same for African Americans and Hispanics. What percentage of each group used cigarettes during that year?
Want to see the full answer?
Check out a sample textbook solution
Chapter 3 Solutions
Intermediate Algebra for College Students (7th Edition)


- The earnings per share for a social media company were $5.19 in 2017 and $7.53 in 2018. Use the midpoint formula to estimate the earnings (in dollars) per share in 2019. Assume that the earnings per share followed a linear pattern. $_______ per sharwarrow_forwardLet f and g be linear functions with equations f(x) = m1x + b1 and g(x ) = m2x +b2. Is f ° g also a linearfunction? If so, what is the slope of its graph?arrow_forwardThe manager of a furniture factory finds that it costs $2200 to produce 100 chairs in one day and $4600 to produce 300 chairs in one day. (a) Assuming that the relationship between cost and the number of chairs produced is linear, find a linear function C that models the cost of producing x chairs in one day. C(x) =arrow_forward
- find a linear function that satisfies the following property: Passing through (4,−1) and (1,3).arrow_forwardA baseball team plays in a stadium that holds 66000 spectators. With the ticket price at $11 the average attendence has been 30000. When the price dropped to $9, the average attendence rose to 33000. Assume that attendence is linearly related to ticket price.arrow_forwardFind the linearization of the function at a.arrow_forward
- In each of Exercises, fill in the blank. If two variables are ________ linearly correlated, one of the variables tends to decrease as the other increases.arrow_forwardHamed own a local gold market that currently has 1159129 subscriber in Instagram at a quarterly charge of R.O. 19. He notices that if he raises the price of his commodity to R.O. (19 + 4), he will lose 9127 subscriber. Assuming that subscriptions are linearly related to the price, what price should Hamed charge for a quarterly subscription to maximize his revenue?arrow_forwardConsider the linear function y = ax + b. If x changes at a constant rate, does y change at a constant rate? If so, does it change at the same rate as x? Explain in full detailarrow_forward
- A cellular phone service provider charges $45 per month and $0.08 per minute of airtime. Enter the linear model that represents the monthly charge, c, as a function of t, the airtime used, in minutes. C (T)=arrow_forwardGiven the linear function below,arrow_forwardThe following table shows net income I Of and art dealer when he pays for supplies and sells n items. Find a linear model for the net income as a function of numbers of items sold. arrow_forward
 Algebra & Trigonometry with Analytic GeometryAlgebraISBN:9781133382119Author:SwokowskiPublisher:Cengage