Concept explainers
Videos
The graph shows the percentage of U.S. parents willing to pay all, some, or none their child’s college education.
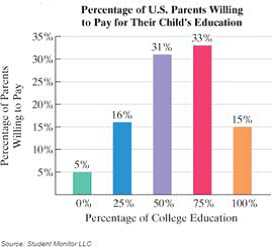
Use the bars that represent none, mar, and all of a college education. Represent me data for each bar as an ordered pair (x, y), where x is the percentage of college education and y is the percentage or parents willing to pay for mat percent or their child S education.
The three data points in part can be modeled by the quadratic function
Substitute each ordered pair into this function, one ordered pair at a time, and write a system of linear equations in three variables that can be used to find values for a, b. and c. It is not necessary to solve me system.

Trending nowThis is a popular solution!

Chapter 3 Solutions
Intermediate Algebra for College Students (7th Edition)


 Glencoe Algebra 1, Student Edition, 9780079039897...AlgebraISBN:9780079039897Author:CarterPublisher:McGraw Hill
 College Algebra (MindTap Course List)AlgebraISBN:9781305652231Author:R. David Gustafson, Jeff HughesPublisher:Cengage Learning
 Algebra & Trigonometry with Analytic GeometryAlgebraISBN:9781133382119Author:SwokowskiPublisher:Cengage
 Algebra: Structure And Method, Book 1AlgebraISBN:9780395977224Author:Richard G. Brown, Mary P. Dolciani, Robert H. Sorgenfrey, William L. ColePublisher:McDougal Littell
 Elementary AlgebraAlgebraISBN:9780998625713Author:Lynn Marecek, MaryAnne Anthony-SmithPublisher:OpenStax - Rice University