
Concept explainers
Videos
Hurricanes The following data represent the atmospheric pressure (in millibars) and the wind speed (in knots) measured during various tropical systems in the Atlantic Ocean.
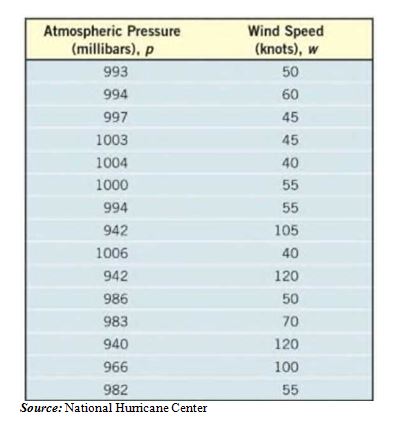
(a) Use a graphing utility to draw a
(b) Use a graphing utility to find the line of best lit that models the relation between atmospheric pressure and wind speed. Express the model using function notation.
(c) Interpret the slope.
(d) Predict the wind speed of a tropical storm if the atmospheric pressure measures 990 millibars.
(e) What is the atmospheric pressure of a hurricane if the wind speed is 85 knots?
Want to see the full answer?
Check out a sample textbook solution
Chapter 3 Solutions
Precalculus Enhanced With Graphing Utilities, 1/e
Additional Math Textbook Solutions
Single Variable Calculus: Early Transcendentals (2nd Edition) - Standalone book
Precalculus (6th Edition)
Calculus and Its Applications (11th Edition)
Calculus: Single And Multivariable
Advanced Mathematical Concepts: Precalculus with Applications, Student Edition
Precalculus: Mathematics for Calculus (Standalone Book)


- Mosteller Formula for Body Surface Area: Body surface area is an important piece of medical information because it is a factor in temperature regulation as well as some drug level determinations. The Mosteller formula gives one way of estimating body surface area B in square meters. The formula uses the weight w in kilograms and the height h in centimeters. The relation is B=hw60 In this exercise, we consider people who are 190 centimeters tall. a. Write a formula for B as a function of w. b. Make a graph of B versus w. includes weights up to 100 kilograms. c. Is the graph you made in part b concave up or concave down? d. In this part, we consider the effect of weight gain on men who are 190 centimeters tall. Would the weight gain have a greater effect on surface area for a lighter man or for a heavier man?arrow_forwardHigh School Graduates The following table shows the number, in millions, graduating from high school in the United States in the given year. Year Number graduating in millions 1985 2.83 1987 2.65 1989 2.47 1991 2.29 a. By calculating difference, show that these data can be modeled using a linear function. b. What is the slope for the linear function modeling high school graduations? Explain in practical terms the meaning of the slope. c. Find a formula for a linear function that models these data. d. Express, using functional notation, the number graduating from high school in 1994, and then use your formula from part c to calculate that value.arrow_forward
 Algebra & Trigonometry with Analytic GeometryAlgebraISBN:9781133382119Author:SwokowskiPublisher:Cengage
 Functions and Change: A Modeling Approach to Coll...AlgebraISBN:9781337111348Author:Bruce Crauder, Benny Evans, Alan NoellPublisher:Cengage Learning
 Glencoe Algebra 1, Student Edition, 9780079039897...AlgebraISBN:9780079039897Author:CarterPublisher:McGraw Hill
 College AlgebraAlgebraISBN:9781305115545Author:James Stewart, Lothar Redlin, Saleem WatsonPublisher:Cengage Learning