Experts fear that without conservation efforts, tigers could disappear from the wild by 2022. Just one hundred years ago, there were at least 100,000 wild tigers. By 2010, the estimated world tiger population was 3200. The bar graph shows the estimated world tiger population for selected years from 1970 through 2010. Also shown is a polynomial function, with its graph, that models the data. Use this information to solve Exercises 73-74. a. Find and interpret f (10). Identify this information as a point on the graph of f b. Does f (10) overestimate or underestimate the actual data shown by the bar graph? By how much? c. Use the Leading Coefficient Test to determine the end behavior to the right for the graph of f . Might this function be useful in modeling the world tiger population if conservation efforts to save wild tigers are successful? Explain your answer.
Experts fear that without conservation efforts, tigers could disappear from the wild by 2022. Just one hundred years ago, there were at least 100,000 wild tigers. By 2010, the estimated world tiger population was 3200. The bar graph shows the estimated world tiger population for selected years from 1970 through 2010. Also shown is a polynomial function, with its graph, that models the data. Use this information to solve Exercises 73-74. a. Find and interpret f (10). Identify this information as a point on the graph of f b. Does f (10) overestimate or underestimate the actual data shown by the bar graph? By how much? c. Use the Leading Coefficient Test to determine the end behavior to the right for the graph of f . Might this function be useful in modeling the world tiger population if conservation efforts to save wild tigers are successful? Explain your answer.
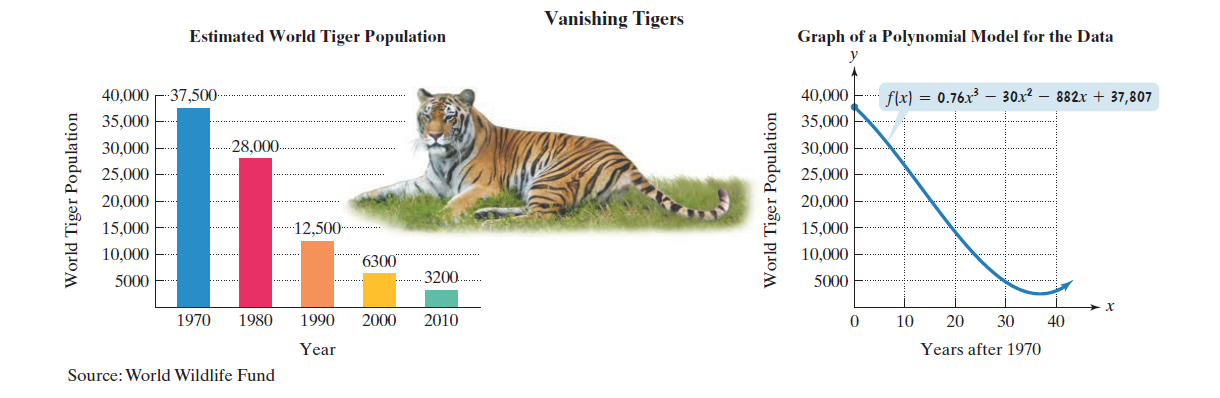
Solution Summary: The author explains how the polynomial function overestimates the world tiger population in 1980.
Experts fear that without conservation efforts, tigers could disappear from the wild by 2022. Just one hundred years ago, there were at least 100,000 wild tigers. By 2010, the estimated world tiger population was 3200. The bar graph shows the estimated world tiger population for selected years from 1970 through 2010. Also shown is a polynomial function, with its graph, that models the data. Use this information to solve Exercises 73-74.
a. Find and interpret f(10). Identify this information as a point on the graph of f
b. Does f(10) overestimate or underestimate the actual data shown by the bar graph? By how much?
c. Use the Leading Coefficient Test to determine the end behavior to the right for the graph of f. Might this function be useful in modeling the world tiger population if conservation efforts to save wild tigers are successful? Explain your answer.
How many turning points (from increasing to decreasing or from decreasing to increasing) occurred for the person's heart rate during the 15 minute film?
What is the degree of the polynomial function of best fit?
Use the graph to estimate the person's maximum heart rate during the 15 minute film. After how many minutes did this maximum heart rate occur?
Use the graph to estimate the person's minimum heart rate during the 15 minute film. After how many minutes did this minimum heart rate occur?
What is an x-intercept of the graph of a quadratic function? How many possible x-intercepts does the graph of a quadratic function have? Explain?
If f is a polynomial function, and f(a) and f(b) have opposite signs, what must occur between a and b. If f(a) and f(b) have the same sign, does it necessarily mean that this will not occur? Explain your answer.
Can the graph of a polynomial function have no x-intercepts? Explain.
Can the graph of a polynomial function have no y-intercepts? Explain.
Write an equation for the polynomial function graphed below
Chapter 3 Solutions
Algebra and Trigonometry - With Learning Guide and MyMathLab
Need a deep-dive on the concept behind this application? Look no further. Learn more about this topic, algebra and related others by exploring similar questions and additional content below.


 Big Ideas Math A Bridge To Success Algebra 1: Stu...AlgebraISBN:9781680331141Author:HOUGHTON MIFFLIN HARCOURTPublisher:Houghton Mifflin Harcourt
 College Algebra (MindTap Course List)AlgebraISBN:9781305652231Author:R. David Gustafson, Jeff HughesPublisher:Cengage Learning
 Algebra & Trigonometry with Analytic GeometryAlgebraISBN:9781133382119Author:SwokowskiPublisher:Cengage