
Concept explainers
Videos
Experts fear that without conservation efforts. tiger could disappear from the wild by 2022. Just out hundred years ago there were at least 100,000 wild tigers, By 2010, the estimated world tiger population was 3200. The bar graph shows the estimated world tiger population for selected years from 1970 through 2010. Also shown is a polynomial function, with its graph, that models the data. Use this information to solve Exercises 73-
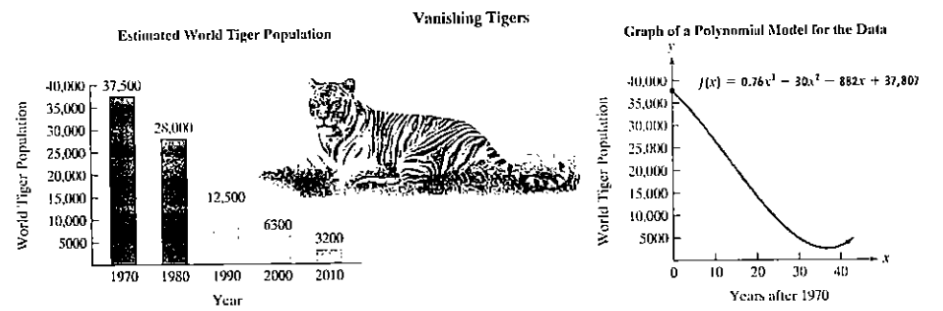
Source: World Wildlife Fund
a. Find and interpret f(10). Identify this information as a point on the graph of f.
b. Does f(10) overestimate or underestimate the actual data shown by the bar graph? By how much?
c. Use the Leading Coefficient Test to determine the end behavior to the right for the graph of f, Might this function be useful in modeling the world tiger population if conservation efforts to save wild tigers are successful? Explain your answer.
Want to see the full answer?
Check out a sample textbook solution
Chapter 3 Solutions
COLLEGE ALGEBRA >IA<


- In Exercises 53-62, find a polynomial function that has the given zeros. (There are many correct answers.) 0,2,4arrow_forwardWhen graphing a polynomial function, how do I determine the location of its turning points?arrow_forwardWrite an equation for the polynomial function graphed belowarrow_forward
- The graph of a polynomial function is given. What is the smallest degree that the polynomial could have?arrow_forwardWrite a polynomial function whose graph is shown (use the smallest degree possible).arrow_forwardWhat do you think the factored form of any polynomial would tell you about the behavior of the related functions graph?arrow_forward
- Determine whether the given statement makes sense or does not make sense, and explain your reasoning : "I’m graphing a fourth-degree polynomial function with four turning points."arrow_forwardIf f is a polynomial function, and f(a) and f(b) have opposite signs, what must occur between a and b? If f(a) and f(b) have the same sign, does it necessarily mean that this will not occur? Explain your answer.arrow_forwardI’m graphing a fourth-degree polynomial function with four turning points. Determine whether the statement makes sense or does not make sense, and explain your reasoningarrow_forward
- I’m graphing a fourth-degree polynomial function with four turning points.Determine whether the statement makes sense or does not make sense, and explain your reasoning.arrow_forwardThe graph to the right is a graph of a polynomial function. (A) What is the minimum degree of a polynomial function that could have the graph? (B) Is the leading coefficient of the polynomial function negative or positive?arrow_forwarddetermine an equation for the following polynomial function, given the graph below. show your work/reasoning.arrow_forward
 Trigonometry (MindTap Course List)TrigonometryISBN:9781337278461Author:Ron LarsonPublisher:Cengage Learning
 College Algebra (MindTap Course List)AlgebraISBN:9781305652231Author:R. David Gustafson, Jeff HughesPublisher:Cengage Learning
 Algebra & Trigonometry with Analytic GeometryAlgebraISBN:9781133382119Author:SwokowskiPublisher:Cengage