
Videos
To graph: the given inequality.
Explanation of Solution
Given information:
Calculation:
The line equation of the inequality can be written as follows:
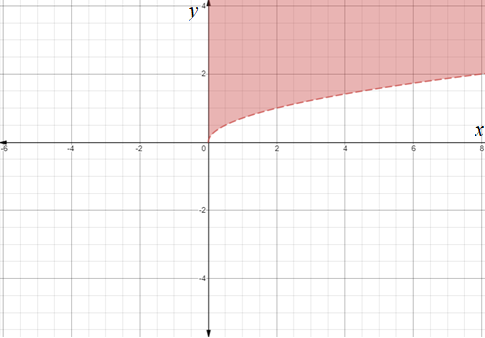
Since the x is under square root, so the graph will be on the first quardrant only.
Make a table of values for line equation of (1) as follows:
| 0 | 1 | 2 | 3 | 4 | ||||
| Not possible | Not possible | Not possible | 0 | 1 |
Plot these points for the equation and test the true points to shade the region of both the inequalities. Since the inequality has less than sign so, the graph will have dotted line.
Check the true point for inequality is as follows:
| Test point | True or False | |
| False | ||
| True |
The graph of the given inequality and shade the region satisfying the inequality as follows:
Chapter 3 Solutions
Advanced Mathematical Concepts: Precalculus with Applications, Student Edition
Additional Math Textbook Solutions
Thomas' Calculus: Early Transcendentals (14th Edition)
Precalculus (10th Edition)
University Calculus: Early Transcendentals (4th Edition)
Calculus and Its Applications (11th Edition)
University Calculus: Early Transcendentals (3rd Edition)


 Calculus: Early TranscendentalsCalculusISBN:9781285741550Author:James StewartPublisher:Cengage Learning
 Thomas' Calculus (14th Edition)CalculusISBN:9780134438986Author:Joel R. Hass, Christopher E. Heil, Maurice D. WeirPublisher:PEARSON
 Calculus: Early Transcendentals (3rd Edition)CalculusISBN:9780134763644Author:William L. Briggs, Lyle Cochran, Bernard Gillett, Eric SchulzPublisher:PEARSON
 Calculus: Early TranscendentalsCalculusISBN:9781319050740Author:Jon Rogawski, Colin Adams, Robert FranzosaPublisher:W. H. Freeman
 Calculus: Early Transcendental FunctionsCalculusISBN:9781337552516Author:Ron Larson, Bruce H. EdwardsPublisher:Cengage Learning