
Concept explainers
Videos
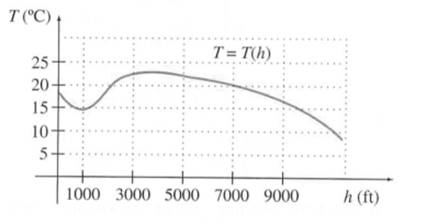
Temperature The graph shows the temperature
| a.
|
b.
|
| c.
|
d.
|
e. At what altitude at or below
f. At what altitude is the temperature the same as it is at
Want to see the full answer?
Check out a sample textbook solution
Chapter 3 Solutions
Calculus For The Life Sciences


- Let f be a function with constant rate of change. Then a f is a ________ function and f is of the form fx = ______x ________. b The graph of f is a __________.arrow_forwardThe American Food Dollar The following table shows the percentage P=P(d) of the American food dollar that was spent on eating away from home at restaurants, for example as function of the date d. d=Year P=Precentspentawayfromhome 1969 25 1989 30 2009 34 a. Find P(1989) and explain what it means. b. What does P(1999) mean? Estimate its value. c. What is the average rate of change per year in percentage of the food dollar spent away from home for the period from 1989 to 2009? d. What does P(2004) mean? Estimate its value. Hint: Your calculation in part c should be useful. e. Predict the value of P(2014) and explain how you made your estimate.arrow_forwardaThe average rate of change of a function f between x=a and x=b is the slope of the ___________ line between (a,f(a)) and (b,f(b)).arrow_forward
 Algebra & Trigonometry with Analytic GeometryAlgebraISBN:9781133382119Author:SwokowskiPublisher:Cengage
 Algebra and Trigonometry (MindTap Course List)AlgebraISBN:9781305071742Author:James Stewart, Lothar Redlin, Saleem WatsonPublisher:Cengage Learning
 College AlgebraAlgebraISBN:9781305115545Author:James Stewart, Lothar Redlin, Saleem WatsonPublisher:Cengage Learning
 Functions and Change: A Modeling Approach to Coll...AlgebraISBN:9781337111348Author:Bruce Crauder, Benny Evans, Alan NoellPublisher:Cengage Learning