
Videos
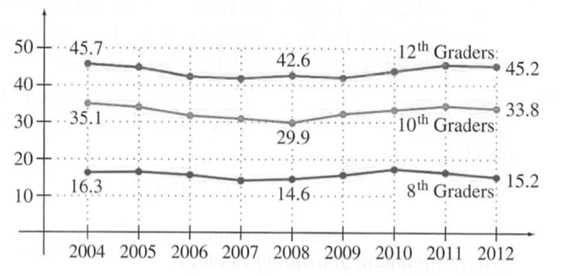
Drug Use The chart on the next page shows how the percent of eight graders, tenth graders and twelfth graders who have used marijuana in their lifetime has varied in recent years.
Source: The Monitoring the Future Study.
a. Find the average annual rate of change in the percent of eight graders who have used marijuana in their lifetime over the four year period
b. Repeat part a for tenth graders.
c. Repeat part a for twelfth graders.
d. Discuss any similarities and difference between your answer to parts a through c, as well as possible reasons for these differences and similarities.
Want to see the full answer?
Check out a sample textbook solution
Chapter 3 Solutions
Calculus For The Life Sciences


- DVD Player Sales The table shows the number of DVD players sold in a small electronics store in the years 2003-2013. Year DVD players sold 2003 495 2004 513 2005 410 2006 402 2007 520 2008 580 2009 631 2010 719 2011 624 2012 582 2013 635 aWhat was the average rate of change of sales between 2003 and 2013? bWhat was the average rate of change of sales between 2003 and 2004? cWhat was the average rate of change of sales between 2004 and 2005? dBetween which two successive years did DVD player sales increase most quickly? Decrease most quickly?arrow_forwardDVD Player sales The table shows the number of DVD play-ers sold in a small electronics store in the years 2003-2013. What was the average rate of change of sales between 2003 and 2013? Whatwas the average rate of change of sales between 2003 and 2004? What was the average rate of change of sales between 2004 and 2005? Between which two successive years did DVD player sales increase most quickly?arrow_forwardFarms in the United States The graph gives the number of farms in the United States from 1850 to 2000. aEstimate the average rate of change in the number of farms between i 1860 and 1890 and ii 1950 and 1970. bIn which decade did the number of farms experience the greatest average rate of decline?arrow_forward
- The U.S. Census tracks the percentage of persons 25 years or older who are college graduates. That data forseveral years is given in Table 4[14]. Determine whether the trend appears linear. If so, and assuming the trendcontinues. in what year will the percentage exceed 35%?arrow_forwardThe US. import of wine (in hectoliters) for several years is given in Table 5. Determine whether the trend appearslinear. Ifso, and assuming the trend continues, in what year will imports exceed 12,000 hectoliters?arrow_forward
 Algebra and Trigonometry (MindTap Course List)AlgebraISBN:9781305071742Author:James Stewart, Lothar Redlin, Saleem WatsonPublisher:Cengage Learning
 College AlgebraAlgebraISBN:9781305115545Author:James Stewart, Lothar Redlin, Saleem WatsonPublisher:Cengage Learning
 Mathematics For Machine TechnologyAdvanced MathISBN:9781337798310Author:Peterson, John.Publisher:Cengage Learning,
 Functions and Change: A Modeling Approach to Coll...AlgebraISBN:9781337111348Author:Bruce Crauder, Benny Evans, Alan NoellPublisher:Cengage Learning
 College Algebra (MindTap Course List)AlgebraISBN:9781305652231Author:R. David Gustafson, Jeff HughesPublisher:Cengage Learning